| PMC full text: | Cell. Author manuscript; available in PMC 2018 Jan 26. Published in final edited form as: Cell. 2017 Jan 26; 168(3): 442–459.e20. Published online 2017 Jan 19. doi: 10.1016/j.cell.2016.12.016 |
Figure 1

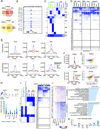
A) Summary of reprogramming stages and data sets produced.
B) Snapshot of indicated genomics data at a candidate genomic locus. N/A = no data. The color code represents the stage-specific chromatin states defined in (C). Red boxes mark the somatic gene Tgfb3 and the pluripotency gene Esrrb.
C) Rows represent chromatin states and their representative mnemonics, color-coded and grouped based on their putative annotation. Cells show the frequency of each histone marks, H3.3, and input for each state (ChromHMM emission probabilities).
D) Columns give % genome occupancy, median length in kilo bases (kb), and fold-enrichment of indicated features (transcription end sites, TES; transcription start sites, TSS; conservation phastCons elements; endogenous retrovirus K elements, ERVK) for each chromatin state described in (C) for MEFs and ESCs. Color-code per column from highest to lowest value.
See also Fig S1.


