| PMC full text: | Cancer Cell. Author manuscript; available in PMC 2019 Jul 23. Published in final edited form as: Cancer Cell. 2018 Jun 11; 33(6): 1017–1032.e7. doi: 10.1016/j.ccell.2018.05.009 |
Figure 4
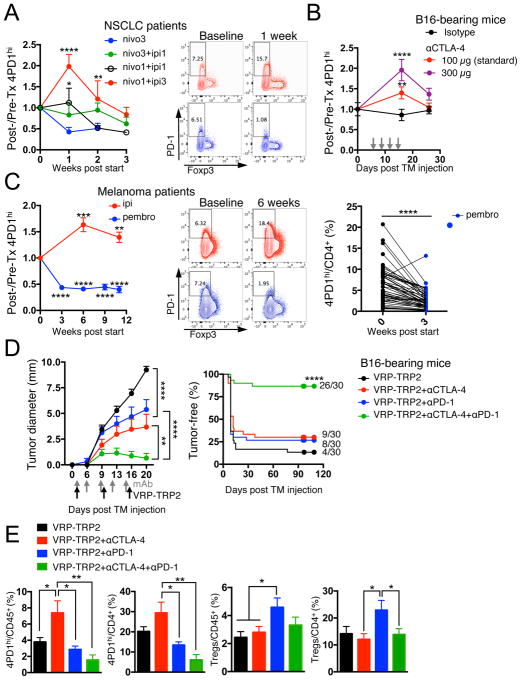
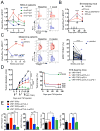
(A) Fold changes in circulating 4PD1hi (percentage of total CD4+) in advanced NSCLC patients during treatment with nivo3 (nivolumab 3 mg/kg, once every 2 weeks (q2wks), n=10), nivo3+ipi1 (nivolumab 3 mg/kg + ipilimumab 1 mg/kg, q3wks, q6wks+q2wks, or q12wks+q2wks, n=21), nivo1+ipi1 (nivolumab 1 mg/kg + ipilimumab 1mg/kg, q3wks, or q6wks, n=11) or nivo1+ipi3 (nivolumab 1mg/kg + ipilimumab 3mg/kg, q3wks, n=8) (average ± SEM; 2-way ANOVA with Bonferroni correction, nivo3 vs nivo1+ipi1 and nivo3 vs nivo1+ipi3). Representative FACS plots of Foxp3 and PD-1 expression in CD4+ T cells from NSCLC patients treated with nivo1+ipi3 (red) or nivo3 (blue) at the indicated time points. (B) Circulating 4PD1hi (percentage of CD4+) in B16-bearing mice treated with αCTLA-4 monotherapy (100 μg or 300 μg/cycle; average ± SEM, n=7–10) relative to naive mice (n=5) (2-way ANOVA with Bonferroni correction, treated vs naive mice). (C) Pairwise comparison of 4PD1hi (percentage of CD4+) at the indicated time points relative to baseline in advanced melanoma patients during ipilimumab (ipi, 3 mg/kg, q3wks; n=47) or pembrolizumab treatment (pembro, 2 or 10 mg/kg, q3wks; n=52) (average ± SEM) (left). Representative FACS plots of Foxp3 and PD-1 expression in CD4+ T cells from melanoma patients treated with ipi (red) or pembro (blue) at the indicated time points (middle). Pairwise comparison of circulating 4PD1hi/CD4+ % at baseline and 3 weeks after pembro (right). (D) Average ± SEM tumor diameter (left; n=10; 2-way ANOVA with Bonferroni correction) and Kaplan-Meier tumor-free survival curves (right; pooled data from 3 independent experiments, n=30; log-rank test; number of tumor-free mice approximately 100 days after tumor implantation is reported for each group) of B16-bearing mice treated with VRP-TRP2 and αCTLA-4 and/or αPD-1 as indicated. (E) Intra-tumor 4PD1hi and Tregs frequencies one day after treatment completion in B16-bearing mice treated as in D (average ± SEM; n=9–10; unpaired t test). * = p<0.05, ** = p<0.01, *** = p<0.001, **** = p<0.0001. See also Figure S4.

