Abstract
Free full text

Immunologic timeline of Ebola virus disease and recovery in humans
Abstract
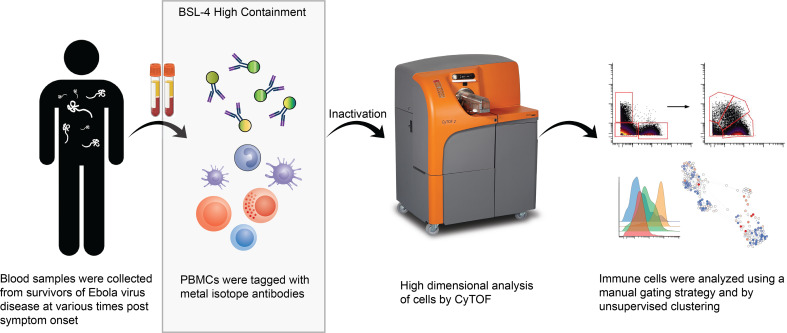
A complete understanding of human immune responses to Ebola virus infection is limited by the availability of specimens and the requirement for biosafety level 4 (BSL-4) containment. In an effort to bridge this gap, we evaluated cryopreserved PBMCs from 4 patients who survived Ebola virus disease (EVD) using an established mass cytometry antibody panel to characterize various cell populations during both the acute and convalescent phases. Acute loss of nonclassical monocytes and myeloid DCs, especially CD1c+ DCs, was noted. Classical monocyte proliferation and CD38 upregulation on plasmacytoid DCs coincided with declining viral load. Unsupervised analysis of cell abundance demonstrated acute declines in monocytic, NK, and T cell populations, but some populations, many of myeloid origin, increased in abundance during the acute phase, suggesting emergency hematopoiesis. Despite cell losses during the acute phase, upregulation of Ki-67 correlated with recovery of cell populations over time. These data provide insights into the human immune response during EVD.
Introduction
Ebola virus (EBOV) infection in humans is characterized by severe, often fatal disease. Various factors have correlated with a fatal outcome, including patient age, high viral load, a dysregulated inflammatory response, endothelial dysfunction, coagulopathy, lymphocyte apoptosis, lack of T cell receptor diversity, declines in NK and monocyte populations, presence of inhibitory markers on activated T cells, and inadequate adaptive immune responses (1–13). Notably, the pathophysiology of Ebola virus disease (EVD) seems to center around the host immune response. Studies of the human immune response during EVD have expanded significantly since the 2014 outbreak in West Africa. However, conducting studies using primary human samples obtained from patients with EVD remains challenging, given that outbreaks typically occur in resource-limited settings, and handling such samples requires appropriate biological containment.
One way in which researchers have circumvented the difficulties surrounding the use of primary human samples from patients with EVD is by exposing human immune cells to EBOV in vitro to understand how viral infection alters cell function. The report of direct infection of DCs and macrophages in EBOV-infected cynomolgus macaques led many research groups to focus on cells of myeloid origin (14). EBOV productively infects monocytes and monocyte-derived macrophages in vitro, stimulates production of inflammatory cytokines, and actively inhibits IFN-α production by these cells (15, 16). At least some of these effects may be mediated via binding of EBOV glycoprotein (GP) to TLR4 on the surface of macrophages (17). However, monocyte-derived DCs, while able to support viral replication, do not produce inflammatory cytokines and are impaired in their ability to stimulate T cells (18, 19). Importantly, when myeloid DCs (mDCs) and plasmacytoid DCs (pDCs) were purified directly from human blood rather than generated in vitro, the mDCs were competent for viral replication, while the pDCs were not (20). Furthermore, pDCs were shown to be resistant to the anti-interferon activity of the EBOV VP35 protein (21). pDCs are the major producers of IFN-α and the drivers of downstream adaptive immunity (22). Since it is well established that T cell activation occurs during human EVD (4, 23), the status of pDCs in patients with EVD is an unexplored area of importance.
Another important type of immune cell that has been the focus of intense study following EBOV exposure is the T cell. Lymphocyte apoptosis has been noted in patients with EVD (10) and reported in vivo in both mouse (24, 25) and nonhuman primate (26) models of EVD. In vitro studies have additionally demonstrated lymphocyte apoptosis, specifically of T cells, upon exposure to EBOV (27), despite the lack of productive T cell infection by EBOV. This effect is mediated at least in part by the detection of EBOV GP by T cell TLR4 (28).
The effects of EBOV on NK cells and B cells are less well understood. Decline in NK cell numbers and certain killer cell immunoglobulin-like receptor (KIR) genotypes is associated with a fatal outcome in patients with EVD (1, 29), but the mechanism of NK cell loss and function of these cells during infection is unknown. Individuals infected with EBOV have a marked plasmablast and activated B cell response and have been shown to produce high-affinity antibodies directed against the viral GP during convalescence (23, 30, 31).
To date, each study of cellular immunity in patients with EVD has focused on a specific cell population. This is in part due to the limitations of flow cytometry, which can typically only handle up to 14 different parameters simultaneously depending on the instrument. This limitation can be overcome by using mass cytometry, which permits substantially more multiplexing. Mass cytometry is a method that uses antibodies labeled with heavy metal tags instead of fluorophores to identify various cell populations according to their marker expression. Labeled cells are detected using time-of-flight mass spectrometry, so the technology is often referred to as CyTOF (32). This method has been used to investigate the human immune system in both natural and disease states (33–38). These high-dimensional analyses offer insight into an immune response that may be missed by detection markers spanning only limited cell populations. In this study, we use mass cytometry to gain a broad yet in-depth overview of the human immune response to EVD.
In the fall 2014, 4 patients with EVD received care in the Emory University Hospital Serious Communicable Diseases Unit (39–42). The close proximity of the CDC, which houses a biosafety level 4 (BSL-4) laboratory with approval for conducting work on EBOV, permitted the cryopreservation of PBMCs from these patients. The availability of these samples combined with a validated mass cytometry antibody panel for human use and the fortuitous presence of a CyTOF mass cytometer on the Emory University campus provided us with the opportunity to identify the consequences of EBOV infection on the human immune system in patients with EVD. In this article, we describe the major findings and, importantly, make the data set available for other investigators to explore.
Results
Sample selection and panel validation.
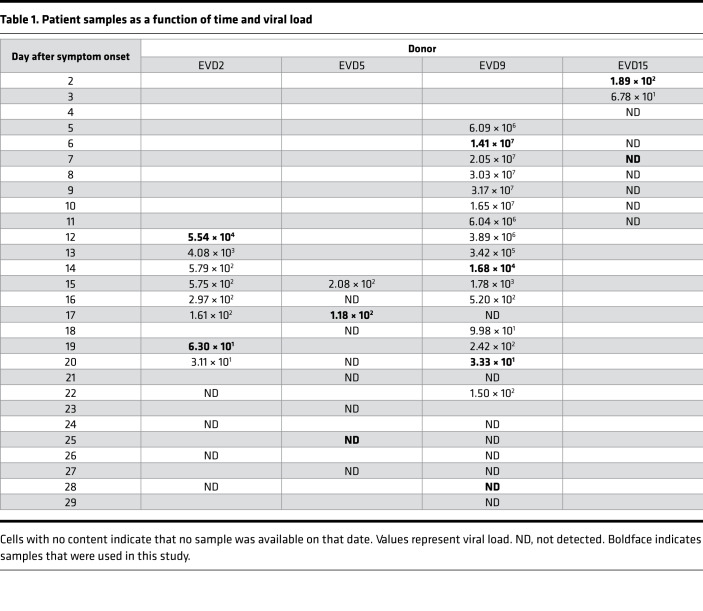
Two time points were selected for each of the patients identified as EVD2, EVD5, and EVD15. The first was the earliest sample available for each patient; in all cases, the patients were still viremic at this point. The second time point chosen was when the patient was clinically in convalescence and when viral load was either markedly lower (in the case of EVD2) or undetectable (EVD5 and EVD15). In these 3 patients, the viral load was clearly declining between the first and second time points, so the first time point was considered to be one in which viral load control had been achieved. EVD9 had more samples collected over a longer period of time. Importantly, for EVD9, samples were available before viral peak, so samples were chosen before and after viral load control was achieved and well into convalescence. Table 1 presents the viral load in each patient sample over time. Samples used in this study are shown in bold. Patient identification and sample dates are identical to those in previously published studies for comparison (8, 23, 30, 31).
Table 1
Given the scarcity of PBMCs from patients with EVD, we wanted to use an established mass cytometry panel for these studies rather than developing and validating a new panel. The panel chosen was developed for use in human immunology studies (43, 44). It contains of a series of surface antibodies for phenotypically classifying cells and a series of phospho-specific antibodies for evaluating intracellular signaling pathways (see Supplemental Table 1 for antibody details; supplemental material available online with this article; https://doi.org/10.1172/jci.insight.137260DS1). Lyophilized aliquots of the validated panel for both surface and intracellular antibodies were first tested on control PBMCs to ensure that the panel performance was consistent using the CyTOF machine at Emory University and that the required fixation for removing EBOV samples from BSL-4 did not alter the results. Signal quality was maintained under these conditions for all markers with the notable exception of CCR7, so this marker was excluded from analysis (data not shown).
Gating strategy and analysis of various cell populations.
Each patient sample tube contained cryopreserved PBMCs that were derived from 2 mL whole blood. For control PBMC samples, 2 × 10⁶ cells were used per tube. The process of preparing PBMCs removes RBCs, neutrophils, and platelets from the sample, so very few of these events are noted, but they were still gated out for downstream analysis. A standard gating strategy (Figure 1) was used to define B cells (CD19+), T cells (CD3+), NK cells (CD3–CD19–CD7+CD56+), NKT cells (CD3+CD161+CD56+CD16+), basophils (CD3–CD19–CD123+HLA-DR–), monocytes (Lin–CD14+ and/or CD16+), and DCs (Lin–CD14–CD16–HLA-DR+). B cells were further classified as plasmablasts (CD38+CD27+), naive (CD27–), or memory (CD27+), and subgrouped as class-switched (IgM–) or non-class switched (IgM+). T cells were classified as CD4+ or CD8+, and activated cells were defined as Ki-67+CD38+. NK cells were classified as CD16+ or CD16–. Monocytes were classified as classical (CD14+CD16–), intermediate (CD14+CD16+), or nonclassical (CD14–CD16+). DCs were further defined as being plasmacytoid (pDC, CD123+) or myeloid (mDC, CD11c+). From this gating strategy, the frequency of each cell type in each sample was determined as a function of non-neutrophil CD45+ events (Figure 2A). Patient samples are shown in comparison to the range obtained from the control samples (gray shading). CD4+ T cells were activated in all patients, as previously published. One striking feature of CD8+ T cell activation was the decreased frequency of activated CD8+ T cells in EVD9 relative to the other patients. This has relevance as a predictor of clinical outcome, as other groups have shown an association between T cell function and survival (3). Indeed, patient EVD9 was seriously ill and would not have survived without intensive care support, while the other 3 patients in the cohort had more moderate disease (40, 42). Importantly the decrease in activated CD8+ T cells in EVD9 was only appreciated because here, activated CD8+ T cells were enumerated as a function of non-neutrophil CD45+ events rather than as a proportion of total T cells, as done previously. In the prior analysis, the magnitude of CD8+ T cell activation as a function of total T cells was similar across all donors (23), and we found a comparable activation of CD8+ T cells as a function of total T cells by CyTOF in present study (data not shown). Using an enumeration based on CD45+ events also revealed a previously unappreciated cell population. This occurs because the cell population that makes up the extra CD45+ events in EVD9 remains largely unaccounted for in traditional gating since it lacks lineage markers, but in our analysis was found to be CD11b+, Ki-67+, and pSTAT3+ (Figure 2B). In EVD9, this population ranged from 1% to as much as 17% (on day 14 after symptom onset) of all of the gated CD45+ events. The other 3 EVD patients also had this cell population, albeit at much lower levels than EVD9 (data not shown). Importantly, control patients did not have substantial quantities of this cell population, and EVD9 had the most. This suggests that the population could have relevance to disease, since EVD9 was severely ill, required extracorporeal support, and would not have survived without intensive critical care. All 4 patients also received experimental therapeutics, some of which could have altered their immune responses (23).
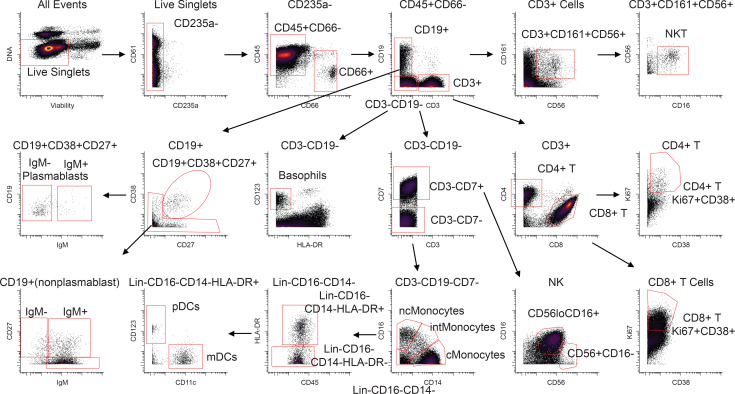
The gating strategy is represented using the day 25 sample from patient EVD5. Common PBMC populations are identified. cMonocytes, classical monocytes; intMonocytes, intermediate monocytes; ncMonocytes; nonclassical monocytes.
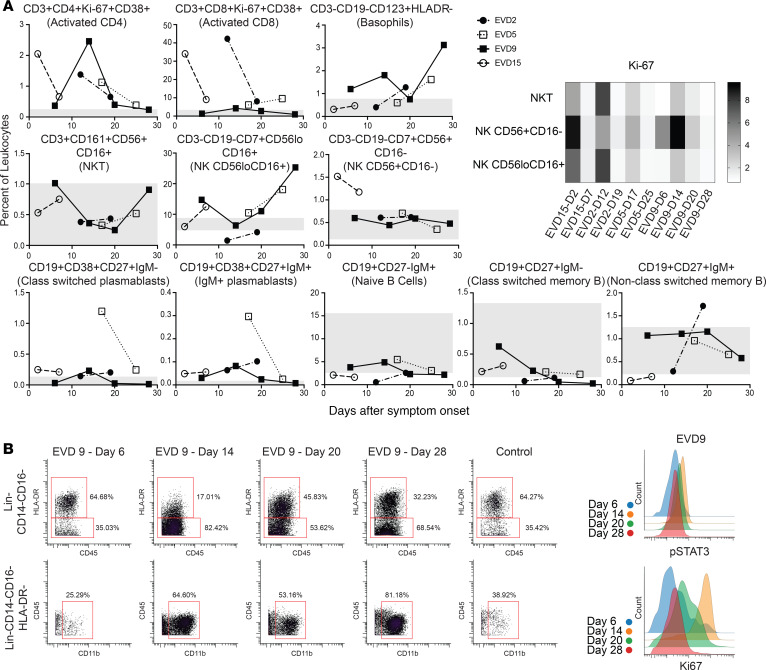
(A) Frequencies of T cells, B cells, basophils, and NK cells as a percentage of CD45+CD66– leukocytes in patients compared with normal healthy controls (range for all controls in gray). Fold increase in median Ki-67 signal as compared with that in a control population is shown for NK and NKT cells at each patient time point. D2, day 2. (B) The expanded Lin–CD14–CD16–HLA-DR– but CD11b+ population that was noted in EVD9 is shown, with histograms demonstrating pSTAT3 and Ki-67 expression in these cells.
The frequency of basophils was elevated in several of the patients at different time points as compared with controls. NKT cells were largely in the control range, and NK cells were low in 1 patient but normal or elevated in the others. Increased proliferation, as evidenced by Ki-67 staining in both NKT and NK cells, was noted in acute-phase samples from all patients (Figure 2A).
As previously reported, plasmablasts were increased in all 4 patients, most prominently in EVD5 at 17 days after symptom onset. Notably, EVD5 was also shown to have the highest numbers of EBOV GP–specific memory B cells in a detailed analysis of the B cell responses of these 4 patients (30). In all patients, samples from all time points contained more class-switched plasmablasts than IgM+ plasmablasts. Frequencies of naive, class-switched memory, and non-class-switched memory B cells were similar to those of controls.
Overall frequencies of classical monocytes were elevated in 3 of the 4 patients at the times sampled, while intermediate and nonclassical monocytes were in the normal range when considered as a frequency of CD45+ events. Using frequencies of non-neutrophil CD45+ events underestimates the dramatic shifts that occur in these populations during the course of the infection (Figure 3A, graphs). Previous work by others had demonstrated decreased numbers of CD16+ monocytes in association with fatal EVD (2), so we evaluated monocytes over time in this cohort of patients. In all patients, an almost complete loss of nonclassical and intermediate monocytes was noted at the earliest time point evaluated (Figure 3A, flow plots), followed by repopulation of first intermediate and then nonclassical monocytes. Notably, this was accompanied by a marked increase in proliferation of classical monocytes that preceded the appearance of intermediate monocytes (Figure 3B).
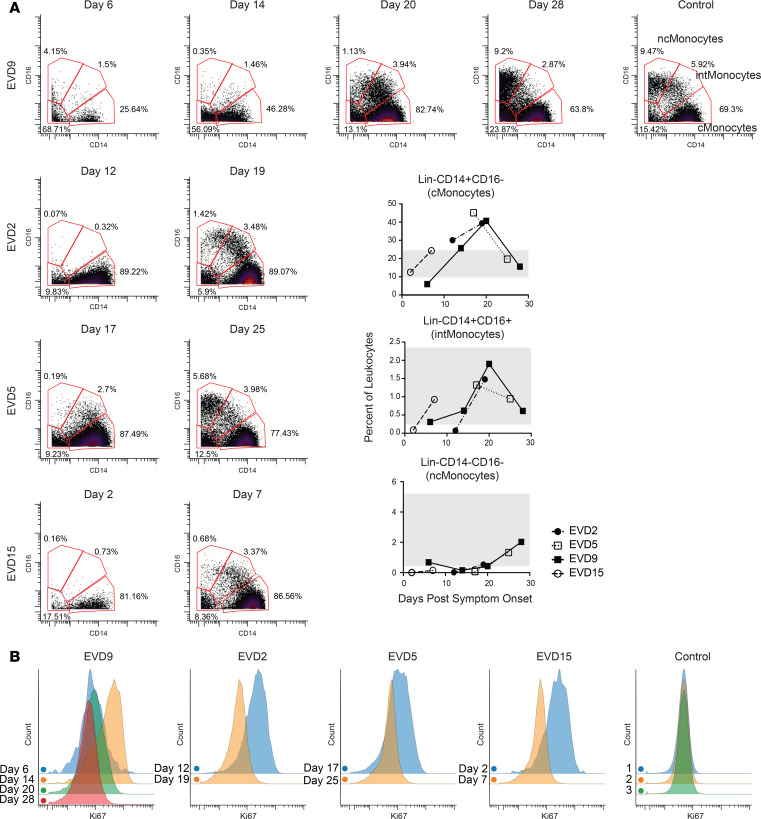
(A) Loss of intermediate and nonclassical monocytes during the acute viremic phase followed by recovery, of first intermediate and then nonclassical monocytes, in convalescence. Quantitation of these cell populations as a percentage of CD45+CD66– leukocytes is shown in graphs (range for all controls in gray). (B) CD14+ monocytes are actively proliferating (Ki-67+) during the acute phase at time points in which viral loads are declining. Samples from a control obtained on 3 separate dates are shown for comparison.
mDC levels were lower than normal at the first time point evaluated in all 4 patients (Figure 4A, graphs). The dramatic loss of mDCs that occurred during the acute phase was more readily appreciated by visualizing raw flow plots (Figure 4A) and was most prominent in the first sample from EVD9, which represents a time in the infection when viral load control had not yet been achieved. Following viral load control and into convalescence, the mDC population returned to control levels in all patients. Subsets of mDCs were also evaluated, and CD1c+ mDCs showed the most striking decline during the acute phase, with robust return and increased expression of CD1c on mDCs during convalescence (Figure 4B). CD141+ mDCs were also evaluated, but an insufficient number were identified in all patients at all time points to make any conclusions regarding this subset.
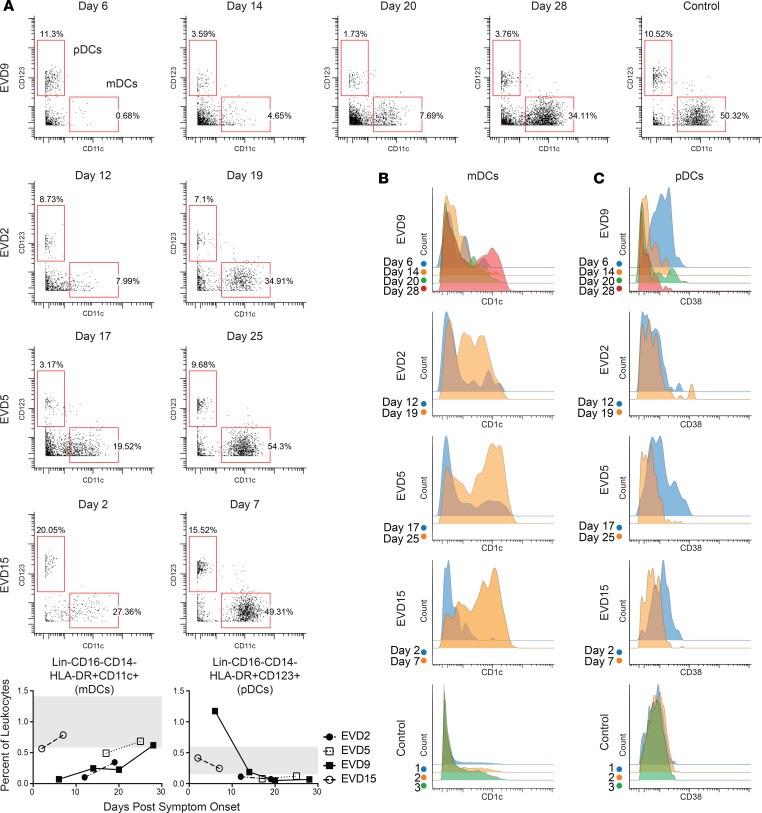
(A) mDCs are lost during the acute phase of disease but return in convalescence. Quantitation of these DCs as a percentage of CD45+CD66– leukocytes is shown in graphs (range for all controls in gray). (B) Coinciding with the return of mDCs in convalescence, CD1c expression on mDCs is dramatically upregulated. (C) pDCs have increased expression of CD38 during the acute-phase time points. Samples from a control obtained on 3 separate dates are shown for comparison for both B and C.
pDC frequencies were elevated above control levels only in EVD9 (Figure 4C), and only at the first time point. Perhaps the marked increase in pDCs in this patient was related to the severity of disease, as at that time point, the patient had all of the clinical, virologic, and laboratory indicators of a fatal outcome. Alternatively, elevated numbers of pDCs could have been secondary to innate immune stimulation of the experimental therapeutic (siRNA) that they received. While not all patients exhibited an absolute increase in pDC numbers, in 3 of the 4 patients, CD38 was upregulated on pDCs at the earliest time point. Importantly, pDCs were observed at all time points and were activated, as evidenced by the expression of the activation marker CD38.
SCAFFoLD maps of cell abundance identify unique cell populations that are expanded during the acute phase of infection.
Multiparameter analyses can also be visualized with an unsupervised approach that can identify similarities and differences in cell populations that are not revealed by traditional gating. Single-cell analysis by fixed force- and landmark-directed (SCAFFoLD) (45) maps were created to illustrate the abundance of various cell populations at the acute versus convalescent time point for each patient (Figure 5A). For EVD9, the time points of day 14 and day 28 were chosen because these were most similar to the time points available from the other patients in previous analyses (phenotypic properties and viral control). Most cells were of lower abundance during the acute phase of disease. However, select cell populations were more abundant during the acute phase, most notably near the monocyte or CD8+ T cell cluster. For example, cluster 41, seen in increased abundance in all 4 patients, is a Lin–CD11b+Ki-67+pSTAT1+ population. Cluster 98, in high abundance in the acute phase in 3 of the 4 patients, is CD4+CD8+Ki-67+pSTAT1+. Double-positive T cells have been reported in other infectious disease processes (46), although their significance is unclear. SCAFFoLD maps of the Ki-67 signal were also generated for all 4 patients (Figure 5B), demonstrating that despite the low abundance of many cell populations at the acute phase, broad, active proliferation also occurred, which may have contributed to normalization of cell numbers over time.
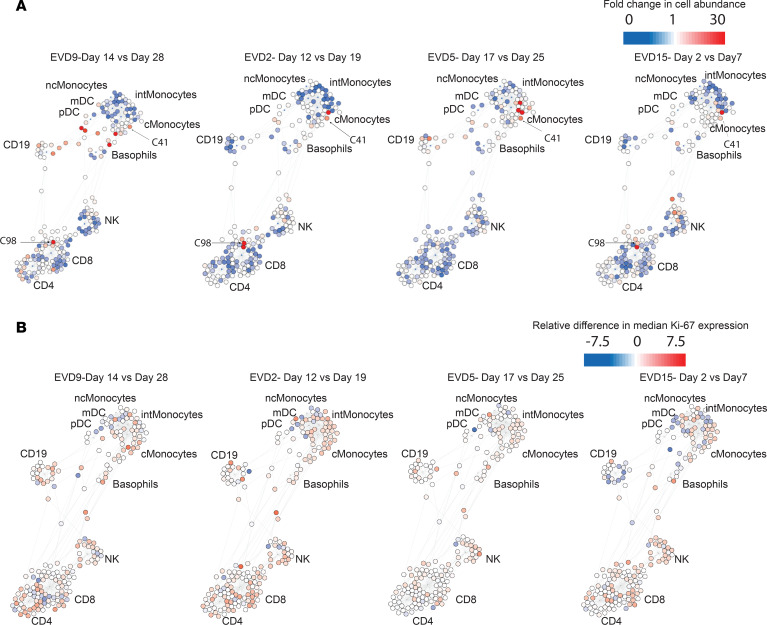
Fold change in cell abundance (A) and differences in median Ki-67 signal (B) at an acute versus a convalescent time point for each patient. Most cell populations, including monocytes, NK cells, and T cells, decrease in abundance during the acute phase but show active proliferation.
Intracellular signaling pathways.
An added benefit of the mass cytometry antibody panel (43) repurposed for this study of patients with EVD is the spectrum of signaling pathways that are assessed using phospho-specific antibodies. The various cell populations that were defined by traditional gating (Figure 1) were evaluated for median signal intensity of each intracellular marker. Values were compared with the median signal intensity for the simultaneously acquired control samples. Fold change in median signal of samples versus controls is represented in heatmaps (Supplementary Figure 1). Increased activity in multiple pathways was noted in various B cell populations from patients with EVD. Caution must be used in interpreting these data, since the samples were not prepared specifically for this analysis, and no phosphatase or kinase inhibitors were included when the samples were obtained or processed for cryopreservation. However, all samples (EVD and controls) were handled similarly, so the marked increases in pSTAT1 observed in naive B cells in 3 of the 4 patients and of pSTAT5 in class-switched plasmablasts seen at later time points in all 4 patients are likely worth noting.
Discussion
In this study, we report changes that occurred in human PBMCs during EBOV infection. Use of mass cytometry for the analyses permitted the application of a large multiparameter antibody panel. This data set provides insights into the human immune response to EBOV infection in vivo. Importantly, published observations from previous work by our group and others using traditional flow cytometry are consistent with our results.
Monocyte loss and repopulation.
The dramatic loss of intermediate and nonclassical monocytes was striking in all 4 patients during the acute phase, in line with prior observations of monocyte loss in patients with EVD (2). EBOV infects monocytes in vitro, so it is possible that these cells were lost to infection-related cell death. However, CD16+ monocytes are known to play a unique role in patrolling and responding to inflammation, so they may be lost from blood due to recruitment to the inflamed tissues (47). While the full function of intermediate monocytes has not been clearly defined, they are believed to play a role in T cell proliferation and stimulation, inflammatory responses, and presentation of antigen (47). Recently, a similar phenomenon was reported to occur during dengue virus infection: intermediate monocytes were lost and then repopulated via upregulation of CD16 on classical monocytes (48). Our finding that intermediate monocytes repopulate first, followed by nonclassical monocytes after marked classical monocyte proliferation, would be consistent with that phenomenon occurring during EVD. Notably, a study performed in humans infected with Chikungunya virus (49) made use of mass cytometry to define and characterize the changes that occur during acute infection and recovery; an expansion of the intermediate monocyte population during the acute phase was observed. Whether this represents differences in time of sampling or differences related to the etiology of the infection is an area for future study.
Evidence for emergency hematopoiesis during EVD.
Analysis of the data using SCAFFoLD maps revealed several unique populations of increased abundance in the acute phase. Interestingly, at least one of these populations (cluster 41) has markers (CD11b+Ki-67+Lin–) similar to those of the large population of cells identified initially in EVD9 and ultimately noted in all 4 patients but, importantly, not in the controls. We hypothesize that these clusters may represent cells of myeloid origin that have egressed from the bone marrow during a time of emergency hematopoiesis. It is well established that physiologic insult, including infection, can lead to expansion of hematopoietic stem cells and myeloid progenitors in order to control an ongoing infection (50, 51). This is an important mechanism for myeloid expansion during inflammation, since, unlike for lymphoid cells, there is no receptor specificity to drive proliferation. Instead, growth factors, such as M-CSF, GM-CSF, and G-CSF, are produced and stimulate the bone marrow to increase myelopoiesis. Indeed, during EVD, all 3 growth factors are produced at higher levels than in normal healthy controls; furthermore, elevated levels of MCSF were associated with severe manifestations of EVD (8). The Lin–CD11b+ cells that we observe during acute EVD have similarities to a population of cells known as myeloid-derived suppressor cells (MDSCs) that have been described in sepsis (52) and arise as a result of emergency hematopoiesis. In fact, these MDSCs are reported to produce IL-10 (which is also elevated in EVD, especially in fatal cases) and TGF-β to exert immunosuppressive effects. In many cases of fatal EVD, patients die from the disease before generating significant adaptive immune responses, and the immunosuppressive milieu generated by MDSCs could explain these findings. The clinical course of patient EVD9 mirrors this: the patient had very high levels of MCSF from 6 to14 days after symptom onset accompanied by high levels of IL-10 during the same time period as noted in a prior publication (8). This also coincides with the high frequency of the Lin–CD11b+ cell population, which peaked on day 14 and constituted 17% of the total non-neutrophil CD45+ events; by day 20, this population decreased to 1.6% (it was less than 0.5% in controls). These findings suggest that, at least in cases of severe EVD, emergency hematopoiesis could be activated.
pDCs as a solution to the EVD IFN paradox.
EBOV encodes potent IFN antagonists that completely block IFN production in vitro (53), though IFN can be detected in the blood of patients (54). Despite these IFN-antagonistic activities of EBOV, some patients manage to mount adaptive immune responses and survive the infection even without therapeutic interventions. This apparent paradox can be explained by the action of pDCs, which are predominantly responsible for generating type I IFN and can present antigens to induce adaptive immunity (22). Important groundwork was laid when Leung et al. demonstrated that pDCs were not susceptible to the IFN-antagonistic activity of VP35 and could be stimulated to generate IFN-α via TLR7 sensing (21). The same authors also demonstrate that pDCs isolated from human blood were refractory to EBOV infection in vitro (20). This led to the conclusion that pDCs could not be activated by EBOV since they were not infected. However, in this study, we demonstrate that during EBOV infection of humans, pDCs upregulate CD38. CD38 is a well-known activation marker on B and T cells, but less has been reported about its role on pDCs. CD38 is a transmembrane glycoprotein that generates adenine dinucleotides to mobilize intracellular calcium; its expression on DCs is critical for DC mobility and T cell priming (55). CD38 can also mediate interactions with endothelial CD31 (PECAM) to facilitate adhesion and migration (56). Work by Mcllwain et al. showed that CD38 signaling on pDCs is responsible for IFN-α production by pDCs (unpublished observation). These data suggest that CD38+ pDCs are active during EVD in humans. Unlike mDCs, they are not markedly decreased in number during EBOV infection, supporting the hypothesis that pDCs are active and functional during EVD and able to support the downstream production of adaptive immunity, which is also well established to occur in humans. It will be important to determine whether pDC activity is different in patients who succumb to disease, and these cells could be an important clinical target for immunotherapeutic interventions.
This work clearly has limitations. Clinical samples were not obtained from all patients throughout the course of infection, the overall sample size is very small, and the 4 patients studied received a myriad of experimental therapeutics that could have altered their clinical and immunologic course. As with many studies in humans, only the blood was sampled, so it is impossible to know how tissue levels of these various immune cell populations changed over time. This study also does not address which immune cells are infected in vivo in humans. The comparator population was normal healthy individuals rather than patients with a sepsis-like picture, which might have provided a broader comparison. However, despite these limitations, this work provides what we believe to be novel observations regarding the consequences of EBOV infection on the human immune response in vivo. Most importantly, this complex, multiparameter analysis cannot be exhaustively evaluated in the present article; therefore, the raw data are available to the scientific community (see Methods) to allow for further study and potential insights into the human immune response during EVD.
In conclusion, we present an assessment of the immune response in peripheral blood to EBOV infection in humans using CyTOF. Notable findings include acute loss of monocyte subsets and mDCs, persistence and activation of pDCs, evidence for emergency hematopoiesis, and marked proliferation activity across many immune cell populations.
Methods
Safety.
All work with infectious materials was performed in the BSL-4 containment space of the CDC.
Sample processing.
Whole blood collected in EDTA tubes was centrifuged 500 g for 5 minutes, and plasma was removed. Packed RBCs and leukocytes were suspended in an equal volume of PBS and layered on top of an equal volume of Ficoll 1077 (MilliporeSigma). Following centrifugation at 500 g for 30 minutes without a brake, the PBMC layer was collected and washed in PBS. Following another centrifugation at 500 g for 5 minutes, the PBMC pellet was suspended in freezing media (90% FBS, 10% DMSO) and aliquoted to cryovials at an equivalent of 2 mL whole blood per tube.
Processing for mass cytometry.
For mass cytometry analysis, cryopreserved PBMC samples were thawed and washed in PBS. For experimental samples, the entire tube of PBMCs (equivalent to 2 mL whole blood) was used. For control samples, 2 × 10⁶ PBMCs were used. To label dead cells, samples were incubated for 5 minutes with 200 μL Cell-ID Cisplatin (Fluidigm) diluted 1:1000 in PBS. Samples were then washed in cell staining medium (CSM) consisting of low-barium PBS with 0.5% BSA and 0.02% sodium azide and barcoded using a Cell-ID 20-Plex Pd Barcoding Kit (Fluidigm). Samples were treated with 1 mL of 1× Maxpar Fix I Buffer for 10 minutes at room temperature (RT), then washed twice in 1 mL of 1× Maxpar Barcode Perm Buffer. Each sample was then incubated with a unique barcode for 30 minutes at RT. Samples were washed twice in 1× Maxpar Cell Staining Buffer, suspended in CSM, combined into a single tube, and filtered through a 70-μm filter to remove debris. Human TruStain FcX (BioLegend) was added (2.5 μL per sample) and incubated for 10 minutes at RT. Surface stains (see Supplemental Table 1 for antibodies used) were then directly added and incubated for 30 minutes at RT with periodic rotation. Samples were washed twice in CSM before the cell pellet was incubated in BD Fix/Perm for 20 minutes at RT. At this point, the samples were removed from BSL-4 containment. Samples were washed twice in CSM; pellets were suspended in 100% ice-cold methanol and stored overnight at –80°C. The following day, samples were washed 3 times in CSM and incubated with intracellular stains (see Supplemental Table 1) for 1 hour at RT. Samples were then washed in CSM and incubated for 20 minutes at RT in an 191/193 Ir DNA Intercalator (DVS Sciences) diluted 1:5000 in PBS with 1.6% paraformaldehyde. Samples were washed 3 times in MilliQ water, then suspended in 0.1× EQ beads (Fluidigm) to a concentration of 1000 stained cells/μL. Events were acquired on a CyTOF 2 Mass Cytometer (Fluidigm).
Data processing.
FCS files obtained from CyTOF were normalized (57) and de-barcoded (58) using standard protocols, and analyzed in CellEngine (Primity Bio). A representative gating strategy (from a single donor) used to identify cell populations is shown in Figure 1. Frequencies of each cell population were determined as a function of total CD45+CD66– events (live, singlet, non-RBC, and non-platelet). Exported frequencies were plotted in Prism (GraphPad) to generate graphs shown in Figures 2–4. Median signal intensity data for all intracellular signaling markers (phospho-antibodies) were exported to Excel (Microsoft). Fold difference in the experimental sample versus the average median of simultaneously acquired control samples was determined, and the data were plotted in heatmap format using Prism to show each patient’s time points and all of the measured cell types (Supplemental Figure 1).
For SCAFFoLD (34) analysis, the CD45+CD66– population was exported as.fcs files and subsampled to 19,000 events per donor and time point (the greatest common denominator among all FCS files). Events were pooled and designated to one of 200 clusters based on their surface marker expression. Landmark nodes were defined by known, gated cell populations from control donors.
Due to the limited sample size, statistical analysis was inappropriate and was not performed.
Study approval.
The patients (2 female, 2 male) were cared for in the Emory Serious Communicable Diseases Unit. IRB approval was obtained from both Emory University (IRB0076700) and the CDC (IRB6643) for the reported studies. PBMCs were obtained from healthy control donors via an approved IRB protocol (CDC1652). All study participants provided written informed consent and were assigned an EVD number. These same designations were used in prior publications (8, 23).
Data availability.
The raw.fcs files generated during this study will be made available to investigators upon request.
Author contributions
AK McElroy designed and conducted experiments, analyzed data, and wrote and edited the manuscript. RSA designed and conducted experiments, analyzed data, and edited the manuscript. DRM designed experiments, analyzed data, and edited the manuscript. HC analyzed data and edited the manuscript. ZBH analyzed data and edited the manuscript. NM conducted experiments. AK Mehta obtained IRB approval, enrolled patients, and edited the manuscript. GN, STN, and CFS supervised the study and edited the manuscript.
Acknowledgments
We would like to thank the patients for their willingness to participate and acknowledge the medical staff of the Emory University Serious Communicable Diseases Unit for providing excellent care to the patients. We thank Tanya Klimova for editing the manuscript. The findings and conclusions in this report are those of the authors and do not necessarily represent the official position of the US Centers for Disease Control and Prevention or the US Food and Drug Administration. AK McElroy was supported by a Burroughs Wellcome award (no. 1013362.01) and an NIH K08 grant (AI119448) during the course of this work. RSA was supported by Cooperative Centers on Human Immunology (CCHI) Opportunity funding 2016–2017. ZBH, DRM, HC, NM, GN were supported by US Food and Drug Administration contracts HHSF223201610018C and HHSF223201210194C. The Defense Advanced Research Projects Agency (W31P4Q-14-1-0010) partially supported this work.
Footnotes
Conflict of interest: The authors have declared that no conflict of interest exists.
Copyright: © 2020, American Society for Clinical Investigation.
Reference information: JCI Insight. 2020;5(10):e137260.https://doi.org/10.1172/jci.insight.137260.
References
Articles from JCI Insight are provided here courtesy of American Society for Clinical Investigation
Full text links
Read article at publisher's site: https://doi.org/10.1172/jci.insight.137260
Read article for free, from open access legal sources, via Unpaywall:
http://insight.jci.org/articles/view/137260/files/pdf
Citations & impact
Impact metrics
Citations of article over time
Alternative metrics
Smart citations by scite.ai
Explore citation contexts and check if this article has been
supported or disputed.
https://scite.ai/reports/10.1172/jci.insight.137260
Article citations
Peripheral immune responses to filoviruses in a reservoir versus spillover hosts reveal transcriptional correlates of disease.
Front Immunol, 14:1306501, 08 Jan 2024
Cited by: 0 articles | PMID: 38259437 | PMCID: PMC10800976
Clinical and Immunologic Correlates of Vasodilatory Shock Among Ebola Virus-Infected Nonhuman Primates in a Critical Care Model.
J Infect Dis, 228(suppl 7):S635-S647, 01 Nov 2023
Cited by: 0 articles | PMID: 37652048 | PMCID: PMC10651209
Depletion of Bone Marrow Hematopoietic Cells in Ebolavirus-Infected Rhesus Macaques: A Possible Cause of Hematologic Abnormalities in Ebolavirus Disease.
Am J Pathol, 193(12):2031-2046, 07 Sep 2023
Cited by: 0 articles | PMID: 37689386 | PMCID: PMC10699128
Ebola Virus Disease Features Hemophagocytic Lymphohistiocytosis/Macrophage Activation Syndrome in the Rhesus Macaque Model.
J Infect Dis, 228(4):371-382, 01 Aug 2023
Cited by: 3 articles | PMID: 37279544 | PMCID: PMC10428198
Ebola virus protein VP40 stimulates IL-12- and IL-18-dependent activation of human natural killer cells.
JCI Insight, 7(16):e158902, 22 Aug 2022
Cited by: 4 articles | PMID: 35862204 | PMCID: PMC9462474
Go to all (20) article citations
Data
Data behind the article
This data has been text mined from the article, or deposited into data resources.
BioStudies: supplemental material and supporting data
Similar Articles
To arrive at the top five similar articles we use a word-weighted algorithm to compare words from the Title and Abstract of each citation.
Comprehensive Characterization of Cellular Immune Responses Following Ebola Virus Infection.
J Infect Dis, 215(2):287-292, 01 Jan 2017
Cited by: 27 articles | PMID: 27799354
Ebola Virus Disease Is Characterized by Poor Activation and Reduced Levels of Circulating CD16+ Monocytes.
J Infect Dis, 214(suppl 3):S275-S280, 11 Aug 2016
Cited by: 20 articles | PMID: 27521367
Early Human B Cell Response to Ebola Virus in Four U.S. Survivors of Infection.
J Virol, 93(8):e01439-18, 03 Apr 2019
Cited by: 14 articles | PMID: 30728263 | PMCID: PMC6450119
Ebola Virus Disease in Humans: Pathophysiology and Immunity.
Curr Top Microbiol Immunol, 411:141-169, 01 Jan 2017
Cited by: 24 articles | PMID: 28653186 | PMCID: PMC7122202
Review Free full text in Europe PMC
Funding
Funders who supported this work.
Burroughs Wellcome Fund (1)
Grant ID: 1013362.01
CCHI Opportunity Funding (1)
Grant ID: 2016-2017
DARPA (1)
Grant ID: W31P4Q-14-1-0010
NIAID NIH HHS (1)
Grant ID: K08 AI119448
NIAID, NIH, USA (1)
Grant ID: AI119448
US FDA (2)
Grant ID: HHSF223201210194C
Grant ID: HHSF223201610018C
