| PMC full text: | Nat Immunol. Author manuscript; available in PMC 2021 May 1. Published in final edited form as: Nat Immunol. 2020 Nov; 21(11): 1430–1443. Published online 2020 Aug 24. doi: 10.1038/s41590-020-0764-8 |
Figure 2.

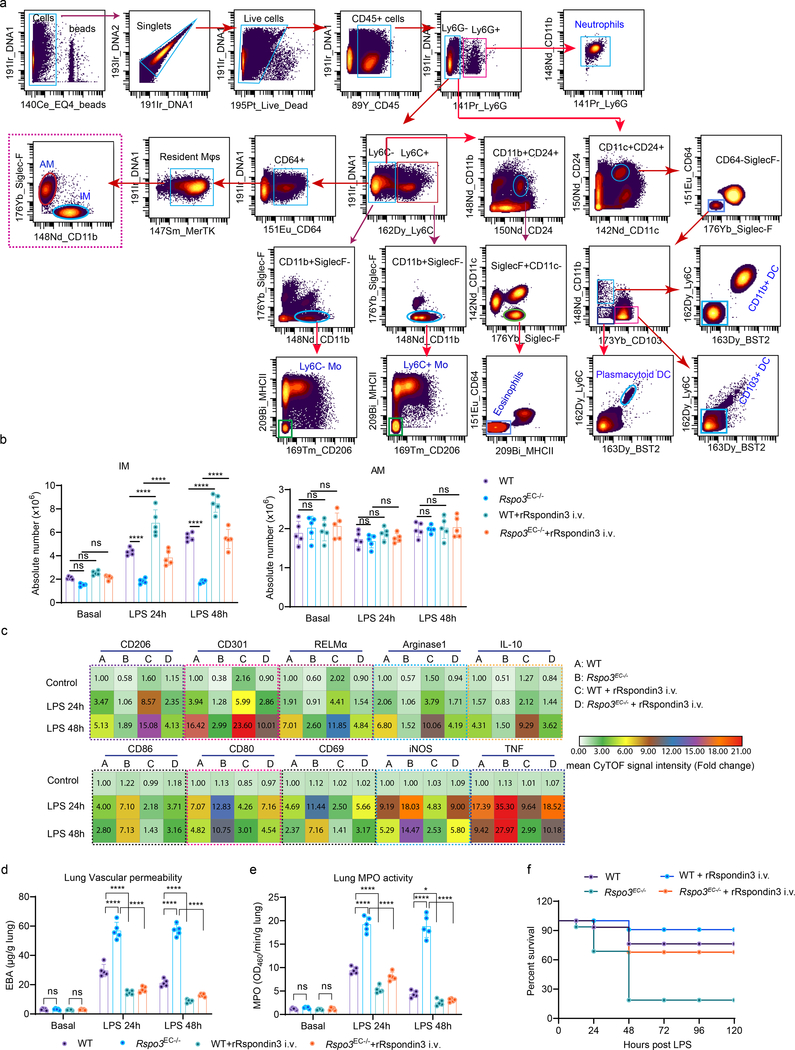
(a) Identifying lung macrophages as well as other myeloid cells by mass cytometry (CyTOF): resident macrophages were identified by CD45+F4/80+Ly6G−Ly6C−CD64+MerTK+, IM and AM were further identified by CD11b+SiglecF− and CD11b−SiglecF+ respectively; other myeloid populations were identified as: Ly6C+ monocyte (Ly6C+ Mo: CD45+Ly6G−Ly6C+CD11b+CD24−MHCII−SiglecF−CD206−), Ly6C− monocyte (Ly6C− Mo: CD45+Ly6G−Ly6C−CD11b+CD24−MHCII−SiglecF−CD206−), Neutrophils (CD45+Ly6G+CD11b+F4/80−), CD103+ DC (CD45+Ly6G−CD11c+CD11b−CD24+CD64−Ly6C−SiglecF−CD103+BST2−), plasmacytoid DC (CD45+Ly6G−CD11c+CD11b−CD24+CD64−Ly6C+SiglecF−CD103−BST2+), CD11b+ DC (CD45+Ly6G−CD11c+CD11b+CD24+CD64−Ly6C−SiglecF−CD103−BST2−), and Eosinophils (CD45+Ly6G−Ly6C−CD11b+CD24+SiglecF+CD11c−MHCII−CD64−); (b) Absolute cell number for lung IM and AM in WT and Rspo3EC−/− mice with or without rRspondin3 i.v. (0.25 mg/kg) under basal conditions and following post-sublethal LPS challenge (12 mg/kg, i.p.) for 24h or 48h as measured by CyTOF (data are representative of three independent experiments with five mice per group). Graphs show the mean ±
± s.d. with each dot representing an individual mouse. Statistical significance was determined by two-way ANOVA with Tukey’s multiple comparisons test using GraphPad Prism with individual P values (left to right) are: IM (ns P=0.3306, ns P=0.5741, ns P=0.2460, ****P<0.0001, ****P<0.0001, ****P<0.0001, ****P<0.0001, ****P<0.0001, ****P<0.0001), AM (ns P=0.8041, ns P=0.9768, ns P=0.9902, ns P=0.9835, ns P=0.7590, ns P=0.9409, ns P=0.9998, ns P=0.9862, ns P=0.9844). (c) Heatmap showing levels of the anti-inflammatory markers (upper panel) and pro-inflammatory markers (lower panel) in lung IM in WT and Rspo3EC−/− mice with or without rRspondin3 i.v. under basal and post-sublethal LPS challenge for 24h or 48h as measured by CyTOF (n = 5 mice per group with three independent repeats, shown as fold changes by the mean CyTOF signal intensity normalized to control group); (d) Lung vascular permeability was measured by using the albumin-Evans blue dye tracer (EBA) in WT and Rspo3EC−/− mice with or without rRspondin3 i.v. under basal and post-sublethal LPS challenge for 24h or 48h (data are representative of three independent experiments with five mice per group). Graphs show the mean
 ±
± s.d, with each dot representing an individual mouse. Statistical significance was determined by two-way ANOVA with Tukey’s multiple comparisons test using GraphPad Prism with individual P values (left to right) are: ns P=0.9997, ns P=0.9996, ****P<0.0001, ****P<0.0001, ****P<0.0001, ****P<0.0001, ****P<0.0001, ****P<0.0001; (e) Myeloperoxidase (MPO) activity of flushed lung samples from WT and Rspo3EC−/− mice with or without rRspondin3 i.v. under basal and post-sublethal LPS challenge for 24h or 48h (data are representative of three independent experiments with five mice per group). Graphs show the mean
 ±
± s.d, with each dot representing an individual mouse. Statistical significance was determined by two-way ANOVA with Tukey’s multiple comparisons test using GraphPad Prism with individual P values (left to right) are: ns P=0.9774, ns P=0.9715, ****P<0.0001, ****P<0.0001, ****P<0.0001, ****P<0.0001, *P=0.0250, ****P<0.0001; (f) Survival curves for WT and Rspo3EC−/− mice with or without rRspondin3 i.v. during endotoxemia conditions (n = 16 mice for each group).


