| PMC full text: | Published online 2021 Feb 18. doi: 10.1002/advs.202004635
|
Figure 4

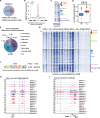
KDM5C activates estrogen/ERα‐target genes directly through its binding on ERα‐bound active enhancers. A) MCF7 cells treated with or without estrogen (E2, 10−7 m, 1 h) were subjected to ChIP‐seq with anti‐KDM5C specific antibody. KDM5C binding sites that overlapped with ERα in the presence of estrogen were shown as indicated. B) KDM5C ChIP‐seq tag density distribution, with or without estrogen (E2), centered on KDM5C sites that co‐localized with ERα (± 3000 bp). C,D) Heat map (C) and box plot (D) representation of the KDM5C ChIP‐seq tag density as shown in (B). E,F) Genomic distribution (E) and motif analysis (F) of KDM5C sites that co‐localized with ERα. G) Heat map representation of KDM5C, ERα, H3K4me1, H3K4me2, H3K4me3, H3K27Ac, P300, H3K9me3, and H3K27me3 ChIP‐seq tag density in the presence or absence of estrogen centered on KDM5C sites that co‐localized with ERα (± 3000 bp). H,I) UCSC Genome browser views of KDM5C, ZMYND8, ERα, H3K4me1, H3K4me2, H3K4me3, H3K27Ac, P300, H3K9me3, and H3K27me3 ChIP‐seq in the presence or absence of estrogen on selected active enhancer regions in the vicinity of estrogen‐induced target genes TFF1 (H) and GREB1 (I). Boxed regions indicated active enhancers.

