| PMC full text: | Mol Cell. Author manuscript; available in PMC 2023 Jan 6. Published in final edited form as: Mol Cell. 2022 Jan 6; 82(1): 60–74.e5. doi: 10.1016/j.molcel.2021.12.015 |
Figure 6.

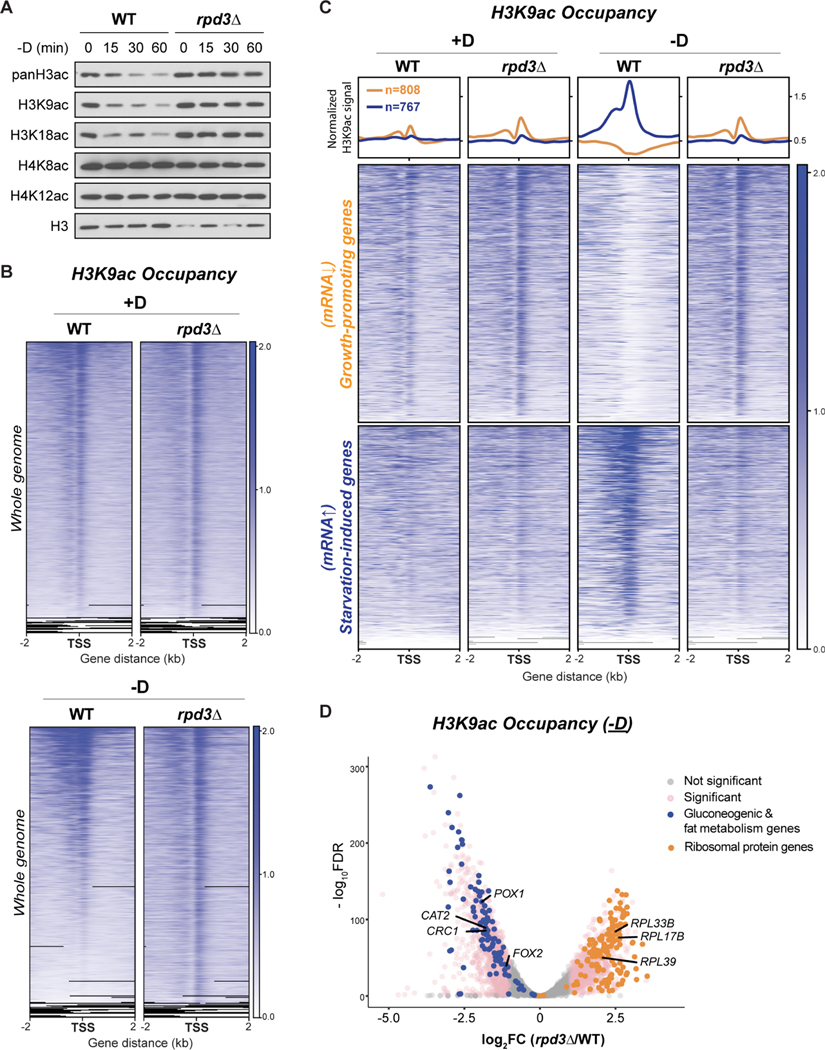
(A) Immunoblots of bulk histone acetylation in WT and rpd3Δ cells upon glucose starvation.
(B) ChIP-seq data displaying genomic occupancy of H3K9ac in WT and rpd3Δ cells under glucose-replete (+D) or glucose starvation (−D) conditions. For each condition, genes were ranked in the order of decreasing signals in WT cells. Genes shown in rows are the same between WT and rpd3Δ cells.
(C) ChIP-seq data displaying H3K9ac occupancy at two subsets of genes in WT and rpd3Δ cells under glucose starvation condition. Metagene profile shows the average H3K9ac signal from each subset of genes: orange line denotes growth-promoting genes; blue line denotes starvation-induced genes. Growth-promoting genes in heatmaps were ranked by signal intensity from glucose-replete condition (+D), while starvation-induced genes were ranked by signal intensity from glucose starvation (−D). Genes shown in rows are the same among all samples.
(D) Volcano plot of ChIP-seq data showing differential occupancy of H3K9ac in rpd3Δ cells compared with WT cells. Thresholds of 2-FC and 0.05 FDR were considered significant. Ribosomal protein genes are colored orange. Gluconeogenic and fat metabolism genes are colored blue.


