Abstract
Free full text

Transgenic overexpression of GLUT1 in mouse glomeruli produces renal disease resembling diabetic glomerulosclerosis
Abstract
Previous work identified an important role for hyperglycemia in diabetic nephropathy (The Diabetes Control and Complications Trial Research Group. N Engl J Med 329: 977–986, 1993; UK Prospective Diabetes Study Group. Lancet 352: 837–853, 1998), and increased glomerular GLUT1 has been implicated. However, the roles of GLUT1 and intracellular glucose have not been determined. Here, we developed transgenic GLUT1-overexpressing mice (GT1S) to characterize the roles of GLUT1 and intracellular glucose in the development of glomerular disease without diabetes. GLUT1 was overexpressed in glomerular mesangial cells (MC) of C57BL6 mice, a line relatively resistant to diabetic nephropathy. Blood pressure, blood glucose, glomerular morphometry, matrix proteins, cell signaling, transcription factors, and selected growth factors were examined. Kidneys of GT1S mice overexpressed GLUT1 in glomerular MCs and small vessels, rather than renal tubules. GT1S mice were neither diabetic nor hypertensive. Glomerular GLUT1, glucose uptake, mean capillary diameter, and mean glomerular volume were all increased in the GT1S mice. Moderately severe glomerulosclerosis (GS) was established by 26 wk of age in GT1S mice, with increased glomerular type IV collagen and fibronectin. Modest increases in glomerular basement membrane thickness and albuminuria were detected with podocyte foot processes largely preserved, in the absence of podocyte GLUT1 overexpression. Activation of glomerular PKC, along with increased transforming growth factor-β1, VEGFR1, VEGFR2, and VEGF were all detected in glomeruli of GT1S mice, likely contributing to GS. The transcription factor NF-κB was also activated. Overexpression of glomerular GLUT1, mimicking the diabetic GLUT1 response, produced numerous features typical of diabetic glomerular disease, without diabetes or hypertension. This suggested GLUT1 may play an important role in the development of diabetic GS.
previous studies confirmed a role for hyperglycemia in mediating tissue complications of diabetes mellitus (8a, 46a), including the kidney. However, the role for intracellular glucose in the glomerular disease, separate from extracellular hyperglycemia, hyperosmolality, and the remainder of the diabetic milieu, has only been examined in cultured cells in vitro (20, 21, 24, 49). Enhanced glucose metabolism has been linked to excessive ECM production in cultured mesangial cells (20); however, the effects of this process in vivo in glomeruli have not been tested, for lack of a model.
In vitro studies of mesangial cells overexpressing GLUT1 from a retroviral-GLUT1 expression construct indicated that an isolated increase in this transporter was associated with excessive glucose uptake (20). This alteration in glucose uptake led to a phenotype in the cultured mesangial cells which resembled changes expected with diabetes mellitus, despite the absence of a high glucose concentration in the culture medium (20, 21, 49). Mesangial cell hypertrophy, PKC activation, AP-1 activation, enhanced aldose reductase expression and activity, sorbitol accumulation, enhanced glycolysis with excess lactic acid production, and excess ECM production were associated with a 43-fold increase in glucose utilization (20, 24, 37, 49). The data suggested that had this increase in GLUT1 occurred in vivo, glomerulosclerosis and other features characteristic of diabetic nephropathy might have developed. Subsequent studies have confirmed increased GLUT1 protein in the renal cortex and renal tubule segments of diabetic mice (6, 32), and in glomeruli of diabetic rats (38) and mice (2). However, the effects of increased GLUT1 in glomeruli in vivo have not yet been delineated. Therefore, here we describe the production of transgenic GLUT1-overexpressing mice. These mice overexpress GLUT1 in their glomeruli, mimicking the diabetic glomerular GLUT1 response. Glomerular GLUT1 overexpression in the transgenic animals was detected predominantly in the mesangial cells. This mouse model allowed us to determine the role that intracellular glucose may play in the development of glomerulosclerosis (GS) in the absence of diabetes.
METHODS
Mice
All animal experiments were performed under a protocol approved by the Institutional Animal Care and Use Committee.
GLUT1-overexpressing transgenic mice with C57BL6/J background (+/+/sense GLUT1, no db allele).
Transgenic mice were produced as described below and backcrossed more than 10 generations to the C57BL6/J background. The C57BL6/J mice were obtained from Jackson Laboratories. The adult transgenic mice were tested and confirmed to be nondiabetic.
Homozygous db/db diabetic mice with C57BL6 background.
Homozygous db/db diabetic mice with C57BL6 background were obtained from crosses of db heterozygotes. Db/db mice were tested and confirmed diabetic (glucose > 250 mg/dl). They were used for comparison with GLUT1-overexpressing transgenic (GT1S) mice, which have no db allele. The db heterozygotes were obtained from Jackson Laboratories. Data from mice with db alleles appear only in Fig. 3B (db/db mouse).
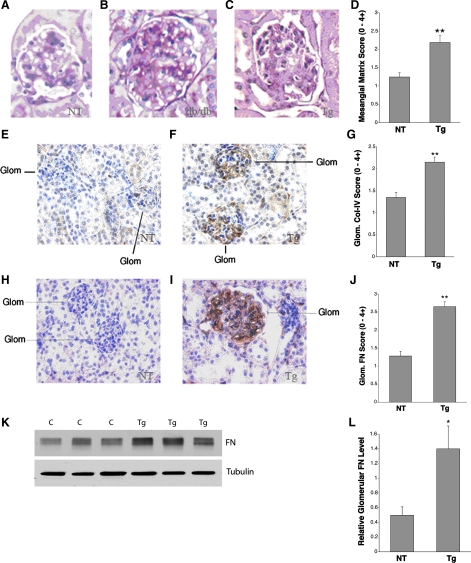
Periodic acid-Schiff (PAS) staining and immunostaining of ECM proteins in thin kidney sections from Tg and NT mice using db/db mice as positive controls for diabetic glomerulosclerosis. All mice have the C57BL6 background. This is the only figure which contains data from a mouse with the db allele, as described here. A: normal, nondiabetic mouse glomerulus, +/+ genotype (no db allele) at age 18 wk with PAS staining. B: diabetic (db/db) glomerulus with glomerulosclerosis on PAS staining at age 18 wk. C: nondiabetic +/+/S (S = sense GLUT1 Tg) mouse glomerulus, age 26 wk, with glomerulosclerosis on PAS staining. D: graph of the mesangial matrix scores for NT, nondiabetic (+/+) mice and GT1S Tg, nondiabetic +/+/S mice at age 26 wk; n = 22–25 glomeruli/group. **P < 0.001 vs. NT. E: type IV collagen immunolabeling in a Nt, nondiabetic mouse (+/+). F: type IV collagen immunolabeling in a nondiabetic, GT1S Tg mouse (+/+/S), age 26 wk. G: graph of type IV collagen (Col-IV) staining scores for nontransgenic (NT: +/+) and GT1S transgenic (Tg: +/+/S) mice, age 26 wk; n = 32–46 glomeruli/group. **P < 0.001 vs. NT. H: immunolabeling of fibronectin (FN) in a NT mouse (+/+), age 26 wk. I: immunolabeling of FN in a GT1S Tg mouse (+/+/S), age 26 wk. J: graph of glomerular FN staining scores in NT and GT1S Tg mice at age 26 wk; n = 14–21 glomeruli/group. **P < 0.001 vs. NT. K: immunoblot of FN (~270 kDa) and the endogenous housekeeping protein β-tubulin (~55 kDa) in NT (+/+) control (C) and GT1S Tg mice (+/+/S) at age 26 wk. L: glomerular FN protein was normalized to endogenous β-tubulin protein to reveal a 2.8-fold increase in FN in glomeruli of the GT1S Tg mice (+/+/S); n = 3/group. *P < 0.05 vs. NT controls (+/+).
Assembly of GT1S GLUT1 Expression Construct
The LK440 vector with a modified human β-actin promoter (16) was used for assembly of the human GLUT1 expression construct. A full-length human GLUT1 cDNA (gift of Dr. Michael Mueckler, Washington University) was ligated into the BamH1 restriction site in the multiple cloning region in the 5′-3′ orientation. The linearized construct was injected into 8-h fertilized eggs obtained from C57BL6 × SJL egg donors, producing more than 10 transgenic founder mice. The transgenic founder mice were repeatedly backcrossed to C57BL6/J mice for more than 10 generations.
Isolation of Mouse Glomeruli
Two different methods of mouse glomerular isolation were used, which gave preparations of >90% purity. These included the iron oxide injection method, whereby iron oxide particles are injected into the aorta and are trapped in the glomerular tufts, and the Dynabead method described by Takemoto et al. (45).
Glomerular Glucose Uptake Rates
These were performed as described by us previously using 3H-labeled 2-deoxyglucose (2-DG) (20). Fresh glomeruli were isolated by use of the Dynabead method (45) or by iron oxide infusion, providing high purity (>90%) preparations for analysis. The numbers of glomeruli obtained from individual mice were sufficient for glucose uptake rate measurements. The glomeruli were suspended in PBS with 0.1 μCi/ml 2-[3H]DG (NEN-PerkinElmer, Wellesley, MA) for 10 min (linear portion of the glucose uptake curve for the freshly isolated glomeruli). An aliquot of each glomerular preparation was taken for calculation of glomerular protein in each sample. Subsequently, the glomeruli were exposed to cold stop solution with 0.1 mM phloretin and isolated by 3-min centrifugation at 1,000 rpm. The glomeruli were then placed in a scintillation cocktail for measurements of 3H activity using a Packard 1500 scintillation counter. The results of disintegrations per minute (dpm)/10 min were then used to back calculate total dpm/10 min in each sample. This number was then converted to nanomoles 2-DG per 10 minutes and normalized to the total glomerular protein content (μg) in the respective samples. The results of the glucose uptake rate measurements were then expressed as percent control and compared between the different groups being studied.
Isolation of Glomerular Mesangial Cells
Glomeruli were isolated as previously described by us (45, 48), using the Dynabead method (45), and cultured in MEM plus F12 medium (3:1) with 10% FBS, EGF (10 ng/ml ), 8 mM glucose, and penicillin (100 U/ml)/streptomycin (0.1 mg/ml) to allow the mesangial cells to grow out. Primary culture mesangial cells were isolated and stained for α-smooth muscle actin with a fluorescence-tagged antibody to confirm their identity on immunofluorescence microscopy, along with confirmation of the typical mesangial cell morphology on light microscopy (10, 20). Primary culture mesangial cells were studied in culture at passages 5–10.
2-[3H]DG Uptake Rate Measurements in Primary Culture Mesangial Cells
These measurements in primary culture mouse mesangial cells were performed as we have described them previously (20, 21). Mesangial cells (4 × 10⁵) were seeded to 35-mm culture plates in their standard 8 mM glucose MEM plus F12 medium (3:1) described above and then placed in a 37°C 5% CO2 incubator for 2 h to attach to the plates. Subsequently, the cells were washed with HBSS and placed in PBS. Then, the cells were exposed to PBS ± 2-[3H]DG (3.27 pmol/ml; NEN/PerkinElmer) for 5 min (linear portion of the glucose uptake curve for the cultured mesangial cells). The cells were then treated with cold stop solution containing 0.1 mM phloretin, which inhibits glucose movement through the facilitative glucose transporters (GLUTs). The cells were washed with HBSS (without calcium and magnesium) and exposed to 0.25% trypsin for 60 s. The cells from each sample were removed for measurements of 2-[3H]DG uptake. Parallel plates which had been seeded with the same number of cells were treated with 1 N NaOH to lyse the cells for measurements of total cell proteins using the bicinchoninic acid (BCA) Assay (Pierce Biotechnology, Rockford, IL). Glucose uptake rate measurements were normalized to cell protein content.
Western Blot Analyses
Glomeruli isolated from nontransgenic and transgenic mice, and cultured mesangial cells harvested from in vitro experiments, were homogenized with lysis buffer (50 mM Tris·HCl, pH 8.0, 2 mM EDTA, 1% Triton X-100, 312.5 mM N-ethylmalemide, 0.2% SDS), and cocktail inhibitor of protein Complete Mini (Roche Diagnostics) with PMSF. The protein concentrations in the samples were determined by the bicinchoninic acid (BCA) protein assay reagent kit (Pierce) with BSA as a standard. Equal amounts of protein from the samples were subjected to SDS-PAGE and electrophoretically transferred to a polyvinylidene difluoride membrane (Millipore, Bedford, MA). The membranes were then blocked with 5% nonfat dry milk in TBST for 1 h at room temperature and incubated with primary antibody in TBST, using one of the following antibodies: anti-GLUT1 antibody (1:2,500 dilution), anti-VEGF antibody (1:1,000 dilution), anti-fibronectin antibody (1:1,000 dilution), anti-collagen IV antibody (1:1,000 dilution), anti-PKCβ1 antibody (1:500 dilution, Santa Cruz Biotechnology), anti-PKCα antibody (1:500 dilution, Santa Cruz Biotechnology), or anti-tubulin antibody (1:1,000, Santa Cruz Biotechnology), followed by incubation with horseradish peroxidase-conjugated anti-rabbit IgG (1:1,000 dilution; Pierce Biotechnology) and washed four times with 1× TBST. The signals were then detected with SuperSignal West Dura Extended Duration Substrate (Pierce Biotechnology). Target protein levels assessed by Western blot analysis were normalized to endogenous β-tubulin protein to account for any variations in protein loading among the lanes. The signals for each protein were quantified with the National Institutes of Health Image v.1.62 program.
Immunolabeling and Periodic Acid-Schiff Staining of Kidney Tissue and Cultured Mesangial Cells
The detection of mesangial matrix accumulation in vivo was performed by periodic acid-Schiff (PAS) staining of paraformaldehyde-fixed kidneys. PAS-stained kidney sections were analyzed in two ways, first by scoring of matrix accumulation (PAS staining) in the glomerular tufts as 0–4+: 1+ staining = 1–25% of the tuft stained; 2+ = 26–50% stained; 3+ = 51–75% stained; and 4+ = 76–100% stained. The second analysis involved measurement of the percent cross-sectional glomerular tuft area stained with PAS, using Adobe Software v.8.0, to determine the mesangial index. The following antibodies were obtained from Santa Cruz Biotechnology and used for immunolabeling studies: the type IV collagen (α1, α3, and α5 mixture) antibody (diluted 1:200), anti-phospho-PKC-α antibody (1:100), PKC β1 antibody (1:100), VEGF receptor II antibody (1:400), NF-κB p65 (1:100), and NF-κB p50 (1:100) antibodies. Additional antibodies used for immunolabeling studies included the GLUT1 antibody (1:400, ADI), VEGF-A antibody (diluted 1:100, Lab Vision), VEGF receptor (VEGFR) I antibody (1:400, Abcam), and fibronectin antibody (1:400, Sigma-Aldrich).
Double Immunofluorescence Detection of Nuclear Translocation by NF-κB p50 and p65 in Glomerular Cells
Double immunofluorescence studies.
Epitope retrieval was carried out on sections by microwave treatment (2 × 5 min in 100 mM sodium citrate, pH 6). Sections were sequentially blocked for nonspecific staining (diluted normal serum, 1:67, 60 min). Blocking was followed by incubation with affinity-purified antibody, control IgG, or antibody preadsorbed with blocking peptide (1 h at room temperature or overnight at 4°C). Immunolabeling of kidney tissue from untreated kidney or immunolabeling with nonimmune serum or rabbit IgG was performed for controls. Immunolabeling with control reagents was negative in all cases. All procedures were carried out at room temperature unless otherwise noted.
Immunolabeling of NF-κB p65 and NF-κB p50.
The sections were washed in TBS after incubation with one of the two primary antibodies, then were incubated with anti-rabbit IgG conjugated with rhodamine (red) for 40 min. After washing three times in TBS, 4–6-diamidino-2-phenylindole (DAPI) dilactate (Molecular Probes, Eugene, OR) was used as a specific nuclear counterstain by following the manufacturer's instructions. The DAPI blue signal and red signal of NF-κB p50 or NF-κB p65 were detected by immunofluorescence microscopy. Nuclear translocation of NF-κB was identified by colocalization of NF-κB labeling (red) and nuclear labeling (DAPI, blue) producing a violet color. The percentage of glomerular nuclei double-stained for DAPI and NF-κB in each glomerular tuft cross section examined was determined for the glomeruli of GLUT1 transgenic mice and their nontransgenic controls, as a marker for NF-κB activation.
Measurements of Blood Glucose, Plasma Creatinine, Blood Urea Nitrogen, Urine Albumin, and Urine Creatinine
Tail blood was collected from nonfasting adult mice for measurements of blood glucose concentrations by use of an Accucheck Simplicity glucometer (Roche Diagnostics, Indianapolis, IN). Mice were placed into individual metabolic cages for 24-h urine collections. Urine albumin was determined with the Albuwell M Test kit (Exocel, Philadelphia, PA), and urine creatinine determined with the Creatinine Companion kit (Exocel). Plasma creatinine was assayed by HPLC (11).
Blood urea nitrogen.
Blood urea nitrogen (BUN) levels were measured with a commercial assay: the Roche UV Assay utilizing urease and glutamate dehydrogenase, following the manufacturer's instructions.
Measurements of Arterial Blood Pressure
These were performed by use of a computer-automated tail-cuff blood pressure- and pulse-monitoring system (Hatteras, MC-4000 Blood Pressure Analysis System). Arterial blood pressure was determined by averaging 20 serial measurements for each mouse after initial equilibration in the restraining chambers. The pulse rate was determined with a photoelectric sensor placed over the tail. Blood pressure measurements by this system have previously been determined to correspond closely with mean intra-arterial pressure.
Measurements of Mean Glomerular Volume
Serial kidney sections were cut onto a single slide and stained with PAS to determine alterations in mean glomerular volume (MGV) using the method of Najafian et al. (34). This calculation involves analyses of two serial sections for each glomerulus examined. A minimum of nine glomeruli in each group were analyzed for MGV measurements.
Measurements of Mean Capillary Diameter
Glomeruli were examined by moving from one edge of the stained kidney sections sequentially across the sample. Paraformaldehyde-fixed kidney sections stained with PAS were examined. All capillary lumens in each glomerulus examined at ×400 magnification were measured for their maximum diameters. The mean capillary diameter (MCD) was then calculated for each glomerulus.
Transmission Electron Microscopic Analyses of Kidney Tissue
Renal cortical tissue was diced into 1-mm blocks for electron microscopy, fixed overnight at 4°C by immersion in half-strength Karnovsky's solution (2.5% glutaraldehyde-2% paraformaldehyde) then transferred into 0.1 M cacodylate buffer for storage (at 4°C). Electron microscopic tissue was embedded in Epon and processed in house. Samples were stained with uranyl acetate and lead citrate. Sections were examined using an Hitachi HS-9 electron microscope (Hitachi, Pleasanton, CA) at 60 kV.
Measurements of glomerular basement membrane thickness by transmission electron microscopic analysis.
Transmission electron microscopic (TEM) images of glomeruli from 26-wk-old mice, taken sequentially moving from one edge of each sample inward, were obtained for measurements of glomerular basement membrane (GBM) thickness by use of orthogonal intercepts. Results are reported in angstroms.
Assessments of podocyte foot process effacement by TEM.
TEM images of glomeruli taken sequentially from one edge of each sample moving inward were obtained for examination of podocyte foot process effacement in mice at age 26 wk. Morphological assessments were performed in a blinded fashion. Results are reported as the percentage of glomerular capillaries affected by podocyte foot process effacement. Eighteen to twenty-six capillary loops were assessed per group.
Statistics
Data to be compared between different groups of mice (means ± SE) was calculated. ANOVA was performed for data where multiple measurements were made over time. Where a significant F-statistic was obtained, Student's t-test was performed for intergroup comparisons. Multiple group comparisons involved a Bonferroni t-test correction. Where appropriate, a χ2 analysis was performed. P < 0.05 was considered significant.
RESULTS
GLUT1 Overexpression in Glomeruli of Transgenic Mice
More than 10 transgenic founder mice were created with 2 sets of egg injections. Transgenic mice were confirmed by Southern blot analysis of tail DNA samples using an SV40 DNA probe on Pst-1-digested genomic DNA. The transgenic mice demonstrated a 0.7-kb labeled band, while nontransgenic mice exhibited no labeled bands. The transgenic founder mice were repeatedly backcrossed to C57BL6/J mice for >10 generations, to produce transgenic mice overexpressing GLUT1 on this background for study and maintenance of the lines. In the kidney, GLUT1 overexpression was detected in glomeruli and small vessels, but not in the renal tubules. Glomerular GLUT1 protein was increased 3.5-fold in the transgenic adult heterozygotes (Figs. 1, B and D). This increase was associated with a 3.7-fold increase in the glomerular glucose uptake rate (Fig. 1F) from isolated glomeruli of transgenic adult heterozygotes vs. their controls. Immunolabeling studies indicated that GLUT1 overexpression in the transgenic mouse kidneys was localized to glomerular mesangial cells and small vessels (Fig. 1D). Analyses of transgenic glomeruli indicated that GLUT1 was preferentially overexpressed in mesangial cells, as opposed to podocytes (Fig. 1E, *P < 0.001 vs. nontransgenic mesangial cells).
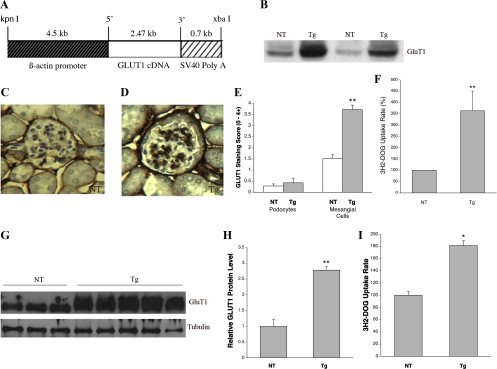
Generation and characterization of GLUT1 transgenic mice. A: GLUT1 expression construct demonstrating the modified human β-actin promoter (16) which drives expression from human GLUT1 cDNA, followed by an SV40 polyadenylylation coding signal. B: Western blot of glomerular GLUT1 protein in nontransgenic (NT) and GLUT1-transgenic (GT1S transgenic or Tg) C57BL6 mice, age 26 wk. C: immunolabeling of GLUT1 in a NT glomerulus, age 26 wk. D: immunolabeling of GLUT1 in a GT1S Tg glomerulus, age 26 wk. E: graph of GLUT1 expression in situ in mesangial cells vs. podocytes in GT1S Tg glomeruli; n = 9–14 samples/group. **P < 0.001 vs. NT mesangial cells, age 26 wk. F: graph of glucose uptake rates in GT1S Tg vs. NT glomeruli; n = 4 samples/group. **P < 0.001 vs. NT, age 26 wk. G: Western blot of GLUT1 protein in mesangial cells isolated from glomeruli of GT1S Tg vs. NT mice. H: graph of glomerular GLUT1 protein levels in GT1S Tg vs. NT mesangial cells; n = 3–5/group. **P < 0.002. I: graph of glomerular glucose uptake rates (%) in GT1S Tg vs. NT mesangial cells; n = 12 samples/group. *P < 0.05 vs. NT.
GLUT1 was overexpressed 2.8-fold in transgenic mesangial cells in vitro, isolated from adult heterozygous GLUT1-overexpressing mice, vs. mesangial cells isolated from nontransgenic control mice of the same line (Fig. 1, G and H). Furthermore, overexpression of GLUT1 in the transgenic mesangial cells was accompanied by a 1.8-fold increase in the glucose uptake rate (Fig. 1I). Renal tubules assessed by immunolabeling and by Western blot analyses did not overexpress GLUT1 in the GT1S transgenic kidneys, P > 0.1 vs. NT (not shown), although outside the kidney the GLUT1 transgene overexpressed GLUT1 in the heart, aorta, and brain (23, 28, 47). The prominent overexpression of GLUT1 in glomerular mesangial cells of the heterozygous transgenic mice (Fig. 1) allowed us to test its potential role in producing a diabetic-type glomerular lesion.
Physiological and Metabolic Parameters
The kidney weight/body weight ratio in GT1S transgenic mice was reduced 20% by 26 wk of age compared with the nontransgenic control kidneys from mice of the same line (Fig. 2A) (6.15 ± 0.28 vs. 7.69 ± 0.54, P < 0.05). The transgenic mice also had 23% fewer cortical renal tubules/unit area (P < 0.0005, not shown). In contrast, the nontransgenic control mice exhibited no significant change in the kidney weight/body weight ratio over the 26 wk period of observation (not shown). The blood glucose concentrations (151.4 ± 10 mg/dl in transgenic vs. 148.6 ± 12.8 mg/dl in nontransgenic) and arterial blood pressures (92.9 ± 8.5 mmHg transgenic and 83.6 ± 5.1 mmHg nontransgenic, P > 0.05) were unaltered in the adult transgenic mice vs. the nontransgenic controls (Fig. 2B). The plasma creatinine concentration was increased 25% in the transgenic mice at 26 wk of age (0.078 ± 0.005 mg/dl transgenic vs. 0.062 ± 0.002 mg/dl nontransgenic), although the BUN level was unchanged: 27.4 ± 1.2 mg/dl transgenic vs. 28.3 ± 2.7 mg/dl nontransgenic (Fig. 2C). The urine albumin excretion (albumin/creatinine ratio) was increased 140% by 26 wk of age in the transgenic mice vs. the nontransgenic controls: 303 ± 62 vs. 125 ± 20.7 μg/mg (Fig. 2D).
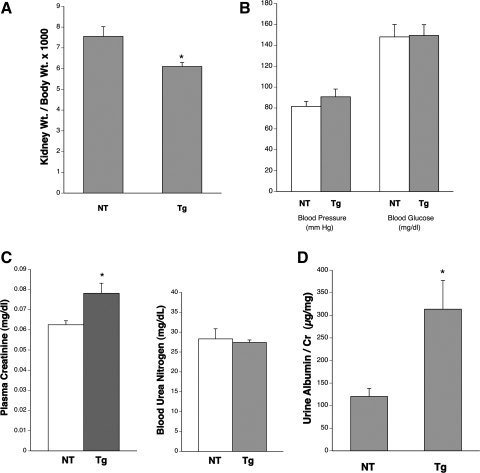
Physiological and metabolic characteristics of mice. A: graph of kidney weight/body weight ratio for NT and Tg mice at age 26 wk; n = 3–5/group. *P < 0.05 vs. NT. B: graph of blood pressure (mmHg) and blood glucose (mg/dl) in adult NT and Tg mice. No significant changes were detected. C: graphs of plasma creatinine (mg/dl) and blood urea nitrogen (BUN; mg/dl) concentrations in NT and Tg mice at age 26 wk; n = 6–10/group. *P < 0.05 vs. NT for plasma creatinine and P > 0.1 for Tg vs. NT BUN levels. D: graph of urine albumin/creatinine ratios as a marker for urine albumin excretion at 26 wk of age in Tg and NT mice; n = 3–5 mice/group. *P < 0.05 vs. NT.
Glomerular ECM Protein Deposition and GS
GS was assessed by PAS staining of fixed kidney sections from nontransgenic (+/+, i.e., no db allele), nontransgenic diabetic (db/db), and transgenic (+/+/sense GLUT1, no db allele) mice at ages 18 and 26 wk (Fig. 3, A–D). All mice had the C57BL6 background. The db/db diabetic, nontransgenic mice developed significant GS by 18 wk of age (Fig. 3B), which progressed at least up to 26 wk of age. In comparison, the nondiabetic GT1S transgenic mice developed GS more gradually, resulting in a significant, moderate severity lesion by 26 wk of age (Fig. 3C) compared with nontransgenic control mice of the same age. The mesangial score (0–4+) for GS was determined for comparison of nontransgenic and GT1S transgenic mice. The mesangial score in 26-wk-old GT1S transgenic mice was increased 64% compared with nontransgenic mice of the same age (Fig. 3D). The transgenic glomeruli revealed diffuse mesangial expansion on light microscopy, occasionally with nodular features, although the nodules were more cellular than human Kimmelstiel-Wilson nodules (51). The mesangial matrix accumulation in the transgenic mice was found to consist of excess type IV collagen (type IV collagen, α1, α3, and α5, Fig. 3, E–G) and fibronectin (Fig. 3, H and l). Immunolabeling scores revealed a 57% increase in glomerular type IV collagen (Fig. 3G) and a 100% increase in glomerular fibronectin in the GLUT1 transgenic mice (Fig. 3J). Immunoblotting of glomerular fibronectin protein revealed a 180% increase in the GT1S transgenic mice (Fig. 3, K and L).
Glomerular Morphometry
To investigate the influence of GLUT1 expression on kidney morphometry, TEM and morphometric measurements were performed in mice at age 26 wk. The TEM revealed excessive mesangial ECM deposition in glomeruli of the transgenic vs. nontransgenic mice (Fig. 4, A and B, arrows). In addition, measurements of GBM thickness by orthogonal intercepts revealed a modest although significant 8% increase in the transgenic mice vs. nontransgenic controls (Fig. 4, C–E, arrows). In Fig. 4, arrows without a tail indicate podocyte foot processes, which were not significantly altered by effacement in the transgenic glomeruli vs. nontransgenic controls (P > 0.05, Fig. 4, C, D, and F). However, determinations of MCD and MGV from PAS-stained kidney sections revealed a 44% increase in the MCD and a 160% increase in the MGV (Fig. 4G). Associated with the changes in glomerular morphometry in 26-wk-old GT1S transgenic mice was a 16% decrease in glomerular cellularity (P < 0.05 vs. nontransgenic mice, Fig. 4H) and the 2.4-fold increase in albuminuria noted above (Fig. 2D).
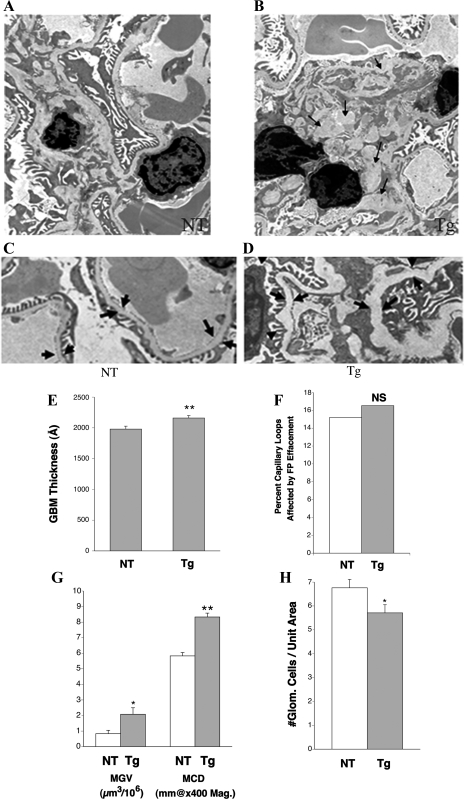
Glomerular morphometric changes in GT1S Tg mice. A: transmission electron microscopy (TEM) image of kidney from a NT mouse, age 26 wk (×5,200 magnification). B: TEM image of kidney from a Tg mouse at age 26 wk (×5,200 magnification). The arrows identify accumulated mesangial matrix proteins. C: TEM image of kidney from a NT mouse, age 26 wk, identifying the glomerular basement membrane (GBM) with arrows (×5,600 magnification). D: TEM image of a Tg glomerulus demonstrating the mildly thickened GBM, age 26 wk (×5,600 magnification). E: graph of GBM thickness determined by orthogonal intercepts in NT and Tg kidneys, age 26 wk. Ten serial GBMs were examined from 3 NT and 3 Tg mice; n = >140 measurements of GBM width in each group, performed by orthogonal intercepts. An 8% increase in GBM thickness was detected in the GT1S Tg mice by age 26 wk. **P < 0.01 vs. NT. F: graph of the percent podocyte effacement in NT and Tg kidneys, age 26 wk; n = 18–26 capillary loops/group. NS, P > 0.05 vs. NT. G: graph of mean glomerular volumes (MGV) and mean capillary diameters (MCD) in NT and Tg mice at age 26 wk; n = 9–18 glomeruli/group. *P < 0.05 vs. NT for MGV and **P < 0.01 vs. NT for MCD. H: graph of glomerular cellularity in NT and Tg mice, age 26 wk; n = 17–18 glomeruli/group. *P < 0.05 vs. NT.
Glomerular VEGF and Transforming Growth Factor-β1
Increasing evidence indicates that VEGF plays an important role in the pathogenesis of diabetic nephropathy (8, 31, 40, 41), while a role for transforming growth factor (TGF)-β1 has been extensively described (42, 53). The growth factors TGF-β1 and VEGF are both increased in diabetic glomeruli and contribute to glomerular disease (25, 27). These growth factors were therefore investigated in the GT1S transgenic mice and their nontransgenic littermates at age 26 wk. The transgenic mice exhibited upregulation of VEGF in the glomeruli by 3.1-fold, which was particularly evident in the mesangium (Fig. 5, A, B, and B1). Furthermore, there were increases in glomerular VEGFR1 (2.7-fold, Fig. 5, C, D, and D1) and VEGFR2 (2.9-fold, Fig. 5, E, F, and F1) for this growth factor, with particularly large increases in the mesangium. The elevated mesangial expression of VEGF-A in the glomeruli suggested it could contribute to the production of GS in these mice, as it may contribute to the glomerular disease of diabetic mice (8, 12). In addition, glomerular TGF-β1 protein increased 2.3-fold in the GT1S transgenic mice (Fig. 5, G and H). Immunoblotting of glomerular VEGF protein revealed a 2.7-fold increase in GT1S transgenic mice vs. the nontransgenic controls (Fig. 5, I and J).
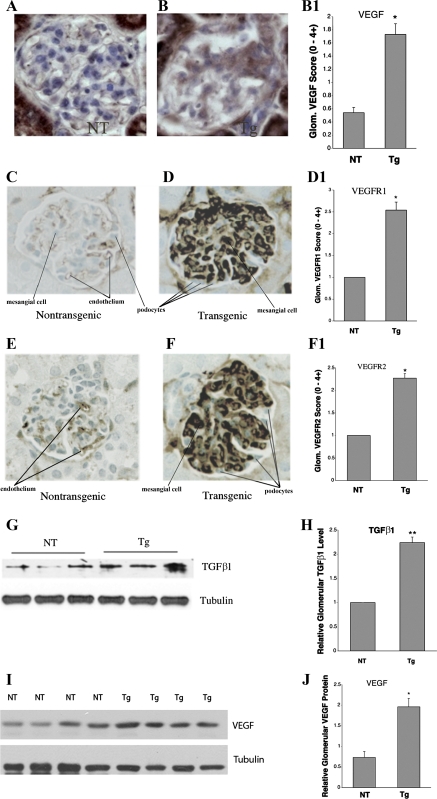
Expression of glomerular VEGF, VEGF receptors (VEGFR), and transforming growth factor (TGF)-β1. A: immunolabeling of VEGF in a NT glomerulus at age 26 wk. B: immunolabeling of VEGF in a GT1S Tg glomerulus at age 26 wk, demonstrating prominent mesangial labeling. B1: graph of VEGF immunolabeling scores in glomeruli of NT and GT1S Tg mice at age 26 wk; n = 39–44 glomeruli/group. *P < 0.001 vs. NT. C: immunolabeling of VEGFR1 in a NT glomerulus at age 26 wk. D: immunolabeling of VEGFR1 in a GT1S Tg glomerulus at age 26 wk. D1: graph of VEGFR1 labeling in NT and Tg glomeruli at age 26 wk; n = 6–7 glomeruli/group. **P < 0.001 vs. NT. E: immunolabeling of VEGFR2 in a NT glomerulus at age 26 wk. F: immunolabeling of VEGFR2 in a GT1S Tg glomerulus at age 26 wk. F1: graph of VEGFR2 labeling in NT and Tg glomeruli at age 26 wk; n = 5–8 glomeruli/group. **P < 0.001 vs. NT. G: TGF-β1 protein in glomeruli from NT and GT1S Tg mice at age 26 wk. H: graph of glomerular TGF-β1 protein in glomeruli from NT and Tg mice at age 26 wk; n = 3–5 samples/group. **P < 0.001 vs. NT. I: immunoblot of glomerular VEGF protein (~42 kDa) and the endogenous housekeeping protein β-tubulin (~55 kDa) in NT control and GT1S Tg mice at age 26 wk. J: glomerular VEGF protein was normalized to endogenous β-tubulin protein to reveal that VEGF was increased 2.7-fold in the GT1S Tg glomeruli; n = 4/group. *P < 0.002 vs. NT mice.
Glomerular PKC Pathway and Transcription Factor Activation
Diabetic nephropathy in mice is associated with glomerular PKC and NF-κB activation, and these factors contribute to ECM production (1, 7, 30, 35, 43). These pathways and growth factors were therefore investigated in the GT1S transgenic mice and their nontransgenic littermates at age 26 wk. The transgenic mice exhibited activation of both PKCβ1 (Fig. 6, A–C, plus total PKCβ1 increased 2.7-fold) and PKCα (active PKCα increased 2.5-fold) (Fig. 6, D–F) pathways in their glomeruli. The downstream transcription factor protein NF-κB p50 was also found to be activated to a greater extent (1.9-fold) in the transgenic glomeruli, as demonstrated by nuclear translocation of NF-κB p50 on double immunofluorescence studies (Fig. 6, G–I). In summary, activation of PKC and growth factor pathways involved in the glomerular disease of GT1S transgenic mice closely resembled their activation in diabetic glomeruli.
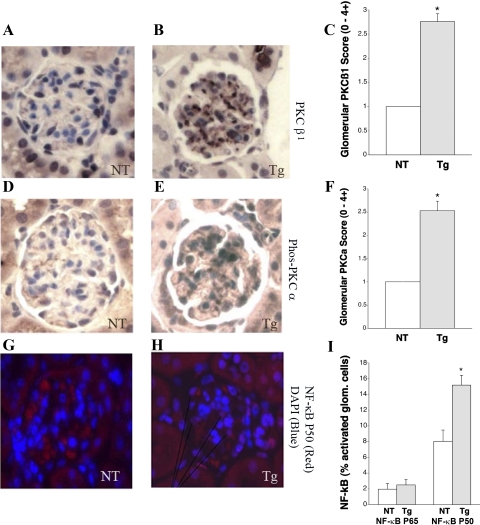
Signaling and transcription factor protein expression in glomeruli. A: immunolabeling of PKCβ1 in a NT glomerulus at age 26 wk. B: immunolabeling of PKCβ1 in a GT1S Tg glomerulus at age 26 wk. C: graph of glomerular PKCβ1 staining scores in NT and GT1S Tg mice at age 26 wk; n = 4–7 glomeruli/group. *P < 0.001 vs. NT. D: immunolabeling of phospho-PKCα in a NT glomerulus at age 26 wk. E: immunolabeling of phospho-PKCα in a GT1S Tg glomerulus at age 26 wk. F: graph of glomerular phospho-PKCα staining scores in NT and Tg mice at age 26 wk; n = 6 glomeruli/group. *P < 0.001 vs. NT. G: double immunolabeling for cell nuclei [4–6-diamidino-2-phenylindole (DAPI), blue] and NF-κB p50 (red) in a NT glomerulus at age 26 wk. H: double immunolabeling for cell nuclei (DAPI, blue) and NF-κB p50 (red) in a GT1S Tg glomerulus at age 26 wk. The violet-colored cells in the GT1S Tg glomeruli indicate translocation of NF-κB p50 to cell nuclei, i.e., activation, with convergence of blue and red. I: graph of NF-κB p65 and p50 activation in NT and GT1S Tg glomeruli at age 26 wk; n = 292–574 glomerular cells assessed/group. No significant change was noted for NF-κB p65. *P < 0.002 vs. NT for NF-κB p50.
Mesangial Cell VEGF Expression In Vitro
We previously identified VEGF as a stimulus for mesangial cell GLUT1, glucose uptake, and fibronectin protein expression (48). In addition, we identified in the present work an increase of VEGF protein in the mesangial space of GT1S transgenic mice. Therefore, here we examined VEGF protein expression in primary culture mesangial cells isolated from GT1S transgenic mice and nontransgenic mice of the same line. VEGF protein was increased 2.2-fold in GT1S transgenic mesangial cells compared with the nontransgenic control, as documented by both Western blot analysis (Fig. 7, A and B) and immunolabeling (Fig. 7, C and D). This increase mirrored the increased mesangial VEGF in vivo in the transgenic mice. In our current model, GLUT1 acts as a trigger to increase mesangial VEGF, which likely contributes to glomerular PKC activation and nuclear translocation of NF-κB p50. The activation of NF-κB is important since it is known to activate matrix genes and to contribute to GS in diabetic nephropathy (1, 3, 36).
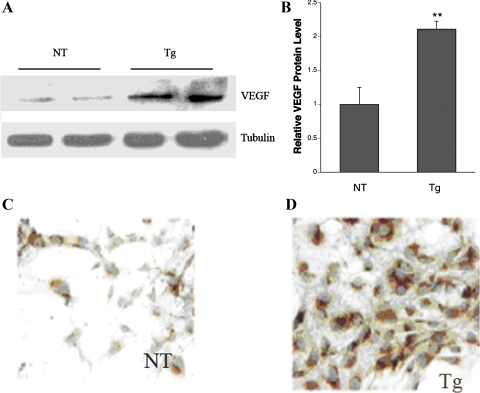
VEGF expression in primary culture mesangial cells. A: Western blot of VEGF-A protein expression in primary culture mesangial cells from NT and GT1S Tg mouse kidneys. B: graph of VEGF protein levels in NT and Tg primary culture mesangial cells; n = 3–4 samples/group. **P < 0.02 vs. NT. C and D: VEGF expression by immunolabeling in primary culture mesangial cells from NT and Tg mice.
A summary of the processes proposed here to contribute to excess ECM production in GT1S transgenic glomeruli is shown in the diagram in Fig. 8. A multitude of events, including increases in TGF-β1, VEGF, VEGFR1, VEGFR2, PKC activation, and NF-κB activation, likely contribute to the glomerular phenotype induced in response to increased GLUT1 with excessive glucose uptake.
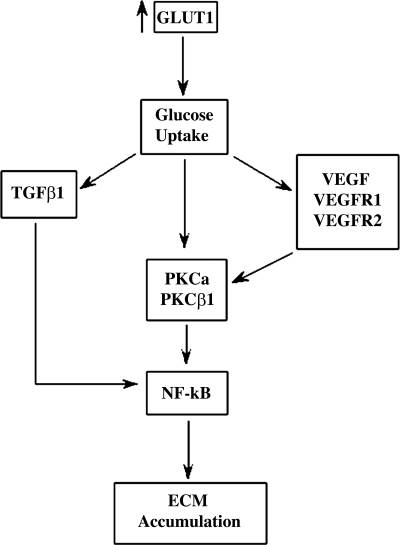
Diagram indicating the postulated functional role of GLUT1 in the development of glomerulosclerosis in GT1S transgenic mice. The primary increase of GLUT1 expression with increased glucose uptake sets in motion the proposed chain of events. These processes may contribute to the development of diabetic nephropathy as well, where glomerular GLUT1 is also increased.
DISCUSSION
Our preliminary studies in db/db diabetic mice demonstrated increased glomerular GLUT1 and glucose uptake compared with nondiabetic controls (2). We also previously reported that mesangial cell GLUT1 expression in vitro increases in response to 20 mM (360 mg/dl) high glucose exposure (22). The increase in GLUT1 was associated with increased glucose uptake (22) and also stimulated ECM production (20). Therefore, increased glomerular GLUT1 in diabetes mellitus may contribute to the development of GS, since enhanced glucose metabolism has been linked to increased mesangial ECM production (20). To test the potential for an increase of glomerular GLUT1 to stimulate development of GS, separate from diabetes and hypertension, we produced transgenic mice overexpressing human GLUT1 from a modified β-actin promoter. This transgene produced increases in glomerular GLUT1 protein and glucose uptake which were in the range of levels we have observed in db/db diabetic mice (2). Tubular GLUT1 protein was not increased by the transgene. Isolation of primary culture mesangial cells from the GT1S transgenic and nontransgenic mice revealed increased GLUT1 protein and glucose uptake in the transgenic mesangial cells, confirming effective transgene expression there.
Increased glomerular GLUT1 and glucose uptake in GT1S transgenic mice was associated with numerous features mimicking the changes of diabetic nephropathy, including increased glomerular TGF-β1 and VEGF, PKC, and NF-κB activation, glomerular hypertrophy with decreased cellularity, and development of GS with a reduction of renal function. The GS involved accumulation of type IV collagen and fibronectin, with late renal atrophy, an increased serum creatinine concentration, and albuminuria which was modest by diabetic standards. The transgenic mice had neither diabetes nor hypertension.
Overexpression of glomerular GLUT1 in the kidney was predominantly mesangial and led to glomerular enlargement. The mechanism for this may be due, at least in part, to hypertrophy of glomerular cells, as glomerular cellularity was decreased. Hypertrophy of mesangial cells was previously reported by us in response to overexpression of GLUT1 from a Moloney murine leukemia virus retroviral expression construct and was associated with a 43-fold increase in cellular glucose utilization (20). Additional mechanisms for enlargement of the transgenic glomeruli are possible, such as cytoskeletal disorganization in mesangial cells, as observed with exposure to high extracellular glucose concentrations, where disorganization of actin filaments with impaired contractile function has been identified (5). The lack of increased kidney mass in GT1S transgenic mice early in life may be due to a lack of GLUT1 transgene expression in renal tubules, despite its overexpression in glomeruli and small vessels. GT1S transgenic mice were also nondiabetic and therefore lacked diabetic stimuli for renal tubular hypertrophy. The renal proximal tubules of diabetic mice are importantly involved in reuptake of excess glucose associated with increased S1 segment GLUT2 expression (9, 33) and hypertrophy (46). In addition, selected renal tubule segments in diabetic mice also increase their GLUT1 expression (4, 32). This was not the case in the nondiabetic GT1S transgenic mice. Therefore, renal tubule segments in diabetic mice have increases in glucose transporters which may contribute to tubular hypertrophy and increased renal mass, a mechanism missing in the GT1S transgenic mice. Finally, the GT1S transgenic mice exhibited a 23% reduction in cortical tubule number by 26 wk of age, which likely contributed to the reduced kidney weight/ body weight ratio in these mice.
Disorganization of actin filaments has been implicated in impaired mesangial contraction, which could predispose to hyperfiltration in the glomerulus (5). The cellular RNA/DNA ratio of GLUT1-overexpressing mesangial cells is increased, indicating cell hypertrophy (20), and is associated with increased production of proteins including aldose reductase, PKCα, PKCβ, IL-6, type IV collagen, type I collagen, fibronectin, and laminin, as well as GLUT1 itself and VEGF-A (24, 49). Other proteins not yet studied likely could have been increased as well, i.e., glucose-responsive proteins, since more than 20 genes were activated in our previous microarray analysis of GLUT1-overexpressing mesangial cells (37). Similar to cultured mesangial cells with induced GLUT1 overexpression (20, 24, 49), glomeruli of GT1S transgenic mice exhibited increases in VEGF-A, type IV collagen, fibronectin, PKCβ1 and PKCα, plus VEGFR1 and VEGFR2. One important difference between chronic GLUT1 overexpression in mesangial cells in vitro and in glomeruli in vivo was that TGF-β1 was not overexpressed in vitro (49). This suggested there may be cellular interactions in vivo in glomeruli that lead to persistently enhanced TGF-β1 expression in response to increased GLUT1.
The GT1S transgenic mice exhibited increased MGV, and the kidneys lost mass over time as they developed progressive GS, with interstitial sclerosis. All of this occurred in the absence of systemic hypertension, but in the presence of enlarged glomerular capillaries, which by LaPlace's law and Kriz's anatomic description of the GBM-mesangial cell attachment sites, would increase capillary wall tension, transmitting the stimulus for stretch to the mesangial cells (29, 39). Therefore, mesangial stretch likely contributed to the GS in GT1S transgenic mice, since in vitro mesangial cell stretch has been shown by us and others to stimulate GLUT1 expression, glucose uptake, and ECM production (13, 48).
Some of the ways in which the renal disease of nondiabetic GT1S transgenic mice differed from the renal disease observed in db/db type-2 diabetic mice are described below. The kidney weight-to-body weight ratio of the transgenic mice was similar to the ratio in the nontransgenic mice at 8 wk of age; however, it fell over time, consistent with loss of renal mass. There was no significant difference in body weight between nontransgenic and transgenic mice at 26 wk of age. The albumin excretion in the transgenic mice reached a level 2.4-fold higher than in nontransgenic controls by 26 wk of age, while db/db diabetic mice typically exhibit an earlier and greater increase in albuminuria (44). Although significant GBM thickening was a feature of the GT1S transgenic glomeruli, the change was small, and the combined findings of modest albuminuria and GBM thickening in GT1S mice vs. diabetic mice suggested the glomerular barrier damage of diabetes requires more than excessive glucose uptake and metabolism in mesangial cells. The relative lack of podocyte damage in GT1S mice is one possible explanation for the lower severity of GBM thickening and albuminuria in these mice. The lack of significant GLUT1 overexpression in podocytes of the transgenic mice might explain their lack of an overt podocyte phenotype.
The plasma creatinine level increased in the GT1S transgenic mice by 26 wk of age; however, this change was relatively modest and was not associated with a change in the BUN level. Previous studies of db/db diabetic mice typically have not detected significant renal failure (44). Future studies following GT1S transgenic mice out to 36 and 40 wk of age will help determine whether the decline in renal function in these mice continues to progress. The loss of renal function in the GT1S transgenic mice may be related to a moderately higher (2.8- vs. 2.1-fold) glomerular GLUT1 expression and higher glomerular glucose uptake rate (1.8- vs. 1.5-fold) in these mice compared with db/db diabetic mice (23). Notably, the renal disease in the GT1S transgenic mice, while exhibiting multiple features of diabetic nephropathy, developed in the absence of diabetes mellitus or hypertension. This emphasized the importance of intracellular glucose in development of the pathology.
A potential role for glomerular (and particularly mesangial) VEGF in the pathogenesis of GS in GT1S transgenic mice was indicated by the combination of increased glomerular and mesangial VEGF, VEGFR1, and VEGFR2 expression, since we have recently found that VEGF is a potent stimulus to mesangial cell glucose uptake and matrix production (48). In addition, TGF-β1 was elevated in the GT1S transgenic glomeruli and likely contributed to GS in the transgenic mice (42, 52). TGF-β1 has previously been shown to stimulate mesangial cell GLUT1 expression and glucose uptake (26, 50). The data in GT1S transgenic mice suggested positive feedback mechanisms could develop between GLUT1 and VEGF, and GLUT1 and TGF-β1, in vivo. Such mechanisms could perpetuate excessive glucose uptake and ECM production in response to elevated glomerular GLUT1.
Investigation of the PKC pathway in GT1S mice indicated activation of both glomerular PKCα and PKCβ1, and these changes were associated with translocation of the transcription factor NF-κB p50 to the nucleus in a subpopulation of glomerular cells, suggesting its activation had occurred as well. NF-κB has previously been implicated in diabetic nephropathy (17–19). Future studies will examine other potential pathways to excess glomerular ECM accumulation in the GLUT1-overexpressing transgenic mice, such as the CTGF, MAPK, JNK, AGE and others.
In summary, we developed nondiabetic, transgenic GLUT1-overexpressing mice. In the kidney, GLUT1 was overexpressed predominantly in glomerular mesangial cells and in small vessels, rather than in podocytes or renal tubules. The increased glomerular GLUT1 mimicked diabetes-induced glomerular GLUT1 expression. This allowed us to examine the contribution of this glucose transporter to the development of glomerular disease. We found that numerous features of diabetic nephropathy were recreated in a relatively diabetes-resistant strain of mice (C57BL6), simply by overexpressing GLUT1. This suggested the GLUT1 glucose transporter could play an important role in the development of diabetic nephropathy. The data also confirmed an important role for intracellular glucose in the development of GS. Future investigations will determine how the GT1S transgenic GLUT1-overexpressing mice may differ from diabetic mice with respect to renal disease to obtain insight into changes which may require extracellular high glucose exposure or exposure to other components of the diabetic milieu.
GRANTS
C. W. Heilig was funded by National Institute of Diabetes and Digestive and Kidney Diseases (NIDDK) Grant UO1 DK60994-01, Juvenile Diabetes Research Foundation Research Grant 1-2004-698, American Diabetes Association Research Grant 7-02-RA-34, American Heart Association Grant Award 0256366U, and Dialysis Clinics, Inc. Grant C-2957. F. Brosius was funded by NIDDK Grant UO1 DK60994-01.
REFERENCES
Articles from American Journal of Physiology - Renal Physiology are provided here courtesy of American Physiological Society
Full text links
Read article at publisher's site: https://doi.org/10.1152/ajprenal.00466.2009
Read article for free, from open access legal sources, via Unpaywall:
https://europepmc.org/articles/pmc2904174
Free after 12 months at intl-ajprenal.physiology.org
http://intl-ajprenal.physiology.org/cgi/content/full/299/1/F99
Free to read at intl-ajprenal.physiology.org
http://intl-ajprenal.physiology.org/cgi/content/abstract/299/1/F99
Citations & impact
Impact metrics
Citations of article over time
Article citations
Single-cell transcriptomics reveals a mechanosensitive injury signaling pathway in early diabetic nephropathy.
Genome Med, 15(1):2, 10 Jan 2023
Cited by: 10 articles | PMID: 36627643 | PMCID: PMC9830686
Molecular mechanisms underlying the role of hypoxia-inducible factor-1 α in metabolic reprogramming in renal fibrosis.
Front Endocrinol (Lausanne), 13:927329, 25 Jul 2022
Cited by: 13 articles | PMID: 35957825 | PMCID: PMC9357883
Review Free full text in Europe PMC
Revisiting Experimental Models of Diabetic Nephropathy.
Int J Mol Sci, 21(10):E3587, 19 May 2020
Cited by: 37 articles | PMID: 32438732 | PMCID: PMC7278948
Review Free full text in Europe PMC
Dendrobium candidum protects against diabetic kidney lesions through regulating vascular endothelial growth factor, Glucose Transporter 1, and connective tissue growth factor expression in rats.
J Cell Biochem, 120(8):13924-13931, 25 Apr 2019
Cited by: 4 articles | PMID: 31021475
Hirsutella sinensis Treatment Shows Protective Effects on Renal Injury and Metabolic Modulation in db/db Mice.
Evid Based Complement Alternat Med, 2019:4732858, 04 Apr 2019
Cited by: 6 articles | PMID: 31080482 | PMCID: PMC6475559
Go to all (30) article citations
Data
Similar Articles
To arrive at the top five similar articles we use a word-weighted algorithm to compare words from the Title and Abstract of each citation.
Podocyte-specific overexpression of GLUT1 surprisingly reduces mesangial matrix expansion in diabetic nephropathy in mice.
Am J Physiol Renal Physiol, 299(1):F91-8, 07 Apr 2010
Cited by: 31 articles | PMID: 20375116 | PMCID: PMC2904178
Nephron-deficient Fvb mice develop rapidly progressive renal failure and heavy albuminuria involving excess glomerular GLUT1 and VEGF.
Lab Invest, 90(1):83-97, 16 Nov 2009
Cited by: 6 articles | PMID: 19918242 | PMCID: PMC4150870
Diabetic kidney lesions of GIPRdn transgenic mice: podocyte hypertrophy and thickening of the GBM precede glomerular hypertrophy and glomerulosclerosis.
Am J Physiol Renal Physiol, 296(4):F819-29, 11 Feb 2009
Cited by: 41 articles | PMID: 19211686
Role for GLUT1 in diabetic glomerulosclerosis.
Expert Rev Mol Med, 8(4):1-18, 06 Feb 2006
Cited by: 18 articles | PMID: 16515729
Review
 1,2
1,2


