Abstract
Free full text

Transcription factor Zeb2 regulates commitment to plasmacytoid dendritic cell and monocyte fate
Significance
Distinct transcription factors regulate the development of immune cell lineages, and changes in their expression can alter the balance of cell types responding to infection. Recent studies have identified Zeb2 as a transcription factor important for the final maturation of natural killer cells and effector CD8+ T cells. In this study, we show that Zeb2 is required for the development of two myeloid cell types, the monocyte and the plasmacytoid dendritic cell, and clarify that this factor is not required for the development of classical dendritic cells.
Abstract
Dendritic cells (DCs) and monocytes develop from a series of bone-marrow–resident progenitors in which lineage potential is regulated by distinct transcription factors. Zeb2 is an E-box–binding protein associated with epithelial–mesenchymal transition and is widely expressed among hematopoietic lineages. Previously, we observed that Zeb2 expression is differentially regulated in progenitors committed to classical DC (cDC) subsets in vivo. Using systems for inducible gene deletion, we uncover a requirement for Zeb2 in the development of Ly-6Chi monocytes but not neutrophils, and we show a corresponding requirement for Zeb2 in expression of the M-CSF receptor in the bone marrow. In addition, we confirm a requirement for Zeb2 in development of plasmacytoid DCs but find that Zeb2 is not required for cDC2 development. Instead, Zeb2 may act to repress cDC1 progenitor specification in the context of inflammatory signals.
Dendritic cells (DCs) comprise several related lineages that initiate and regulate immune responses (1). Classical DCs (cDCs) present antigens to prime naive T cells and produce cytokines to activate T cells and innate lymphoid cells. They can be categorized into two distinct lineages, termed cDC1 and cDC2 (2), that rely on different transcription factors for their development and function. The cDC1 subset includes lymphoid-resident CD8α+ cDCs and tissue-resident CD103+ cDCs that function in cross-presentation of viral antigen and defense against intracellular pathogens. The cDC2 subset includes heterogeneous populations of CD172a (Sirp-α)+ cDCs that promote TH17-type responses to bacteria and fungi and TH2-type responses to parasites. Plasmacytoid DCs (pDCs) are a lineage distinct from cDCs identified by surface expression of CD45R (B220), Siglec-H, and CD317 (Bst2). They do not function directly in T-cell priming (3) but are specialized for production of large quantities of type I IFN in response to infection (4–6).
DCs arise from a series of progenitors with progressively restricted potential (1). Within lineage (Lin)−Kit+Sca-1−IL-7Rα− bone marrow (BM) cells, CD16/32 (FcγRII/III)loCD34+ common myeloid progenitors give rise to all myeloid lineages through FcγRII/IIIhiCD34+ granulocyte–macrophage progenitors (GMPs) and FcγRII/IIIloCD34− megakaryocyte–erythrocyte progenitors. Macrophage–DC progenitors (MDPs) differ from GMPs by decreased expression of Kit and increased expression of the chemokine receptor CX3CR1. MDPs express the receptors M-CSFR and Flt3 and give rise to Kit+M-CSFR+Flt3−Ly-6C+–committed monocyte progenitors (7) and to KitintM-CSFR+Flt3+ common DC progenitors (CDPs). From CDPs, pDCs develop via KitintM-CSFR−IL-7Rα−Flt3+ progenitors (8). Committed progenitors of cDCs also develop from CDPs, and progenitors committed to either the cDC1 or the cDC2 lineage have been identified in the BM and blood (9, 10).
Several transcription factors are required for development of DCs (11). cDC1 development requires Irf8, Nfil3, Id2, and Batf3, whereas pDC development requires Irf8 and Tcf4 (E2-2). cDC2 development was thought to require Irf4; however, recent analysis has shown that cDC2s develop in the absence of Irf4 but lack CD4 expression and have impaired migration from tissues (12, 13). Notch2 is required for cDC2s in the spleen and mesenteric lymph node (LN) to acquire expression of CD4 and ESAM and produce IL-23 in response to pathogens (14–16). Klf4 expression in cDC2s is required to induce protective TH2 responses to Schistosoma mansoni infection (17).
A recent study has argued that the transcription factor Zeb2 (Sip1, Zfhx1b) regulates commitment to the cDC2 lineage by repression of Id2 (18). Zeb2 interacts with Smad proteins and contains N- and C-terminal zinc finger domains flanking a Smad-binding domain, homeodomain, and a C-terminal–binding protein interaction domain (19). Zeb2 represses E-cadherin and other components of cell junctions during epithelial–mesenchymal transition (20, 21), and germline deletion of Zeb2 leads to embryonic lethality in mice (22, 23). Heterozygous Zeb2 defects in humans are associated with Hirschprung’s disease and Mowat–Wilson syndrome, and Zeb2 expression is dysregulated in several human cancers (19). In the nervous system, Zeb2 controls myelination by modulating the activity of Smads activated by bone morphogenetic proteins, members of the TGF-β superfamily (24). In oligodendrocyte precursors, where Zeb2 expression is low in abundance, activated Smads bind the coactivator histone acetyltransferase p300 and activate the expression of negative regulatory genes such as Id2 and Hes1; by contrast, in differentiating oligodendrocytes, expression of Olig1 and Olig2 induces Zeb2, which binds Smad–p300 complexes and represses expression of Id2 and Hes1 (24). Within the hematopoietic system, Zeb2 cooperates with Tbx21 (T-bet) to promote terminal maturation of natural killer (NK) cells and CD8+ T cells (25–27), and its inactivation results in broadly dysregulated hematopoiesis with prominent neutrophilia and loss of B cells and monocytes (28).
Previously, we and others have observed that Zeb2 is down-regulated upon specification of the CDP to the cDC1 lineage (9, 29). Id2 is induced by TGF-β and is required for development of cDC1s but is not required for development of cDC2s (30, 31). Furthermore, the balance between Id2 and E2-2 influences cDC1 and pDC development (32–34), and exogenous TGF-β applied to BM progenitors accelerates differentiation to cDCs rather than pDCs (35). Modest decreases in pDC and cDC2 frequency have been observed in mice with conditional deletion of Zeb2 in CD11c+ cells, leading to the interpretation that Zeb2 regulates commitment of pDC and cDC2 lineages by controlling Id2 expression (18). However, expression of CD11c occurs coordinately with lineage specification or, in the case of the committed cDC1 progenitor, actually occurs after specification (9). Thus, conditional deletion of Zeb2 in CD11c+ cells may not fully eliminate the actions of that transcription factor during lineage specification. To address these issues, we used several systems to control the timing of Zeb2 deletion during DC development, and we find that, in contrast to Scott et al. (18), deletion in early progenitors regulates specification to the pDC lineage but not to the cDC2 lineage. This finding is consistent with reports that Id2 is required for the development of cDC1s but not cDC2s (30, 36). Finally, we found that loss of Zeb2 impaired both the expression of M-CSFR and the development of Ly-6Chi monocytes, implicating Zeb2 activity in the diversification of multiple myeloid lineages.
Results
We generated mice in which Zeb2 is conditionally deleted in cells expressing Cre recombinase driven by the Itgax promoter (CD11c-Cre) (14). Compared with Zeb2-sufficient (Zeb2fl/fl) mice, CD11c-Cre–driven Zeb2-deficient [Zeb2fl/fl;CD11c-Cre(tg)] mice showed substantially decreased pDC frequency in the spleen and skin-draining LN but not in the BM (Fig. 1A). Within the cDC compartment, Zeb2-deficient mice showed an increased ratio of splenic cDC1s to cDC2s (identified by expression of CD24 and Sirp-α, respectively) and an increased ratio of equivalent cell types in other organs (Fig. 1 B and C). Neither spleen nor BM cellularity was significantly different between the two groups (Fig. S1). Using an inducible model of Zeb2 deficiency driven by the type I IFN-inducible Mx1-Cre, pDCs were ablated in vivo 7–9 d after two treatments with poly(I:C) (Fig. 1D), and this ablation persisted for at least 1 y (Fig. 1E). By contrast, the ratio of CD24+:Sirp-α+ cDCs was perturbed only slightly in that system (Fig. 1F). Neither spleen nor BM cellularity was significantly different between the two groups in the second week after poly(I:C) treatment (Fig. S1), although splenomegaly was grossly evident in Zeb2-deficient mice 1 y after treatment. In summary, robust deletion of Zeb2 using Mx1-Cre showed a complete dependence for this factor in pDC development and not in cDC development.
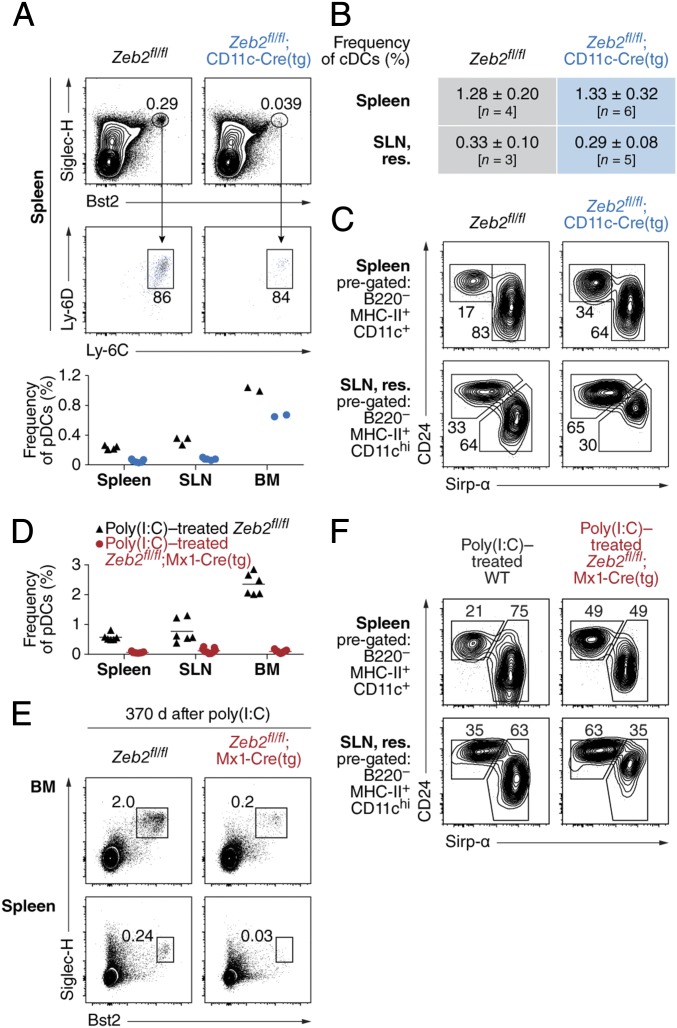
Zeb2 is required for pDC development in vivo. (A) Samples prepared from the spleen, skin-draining LN (SLN), and BM, harvested from mice of the indicated genotypes, are compared for frequency of pDCs. Shown are representative two-color histograms comparing splenic populations (Top) and a plot displaying frequency of pDCs as a proportion of all singlet lymphocytes (Bottom). Numbers at the Top indicate percentage of cells within the indicated gate; dots at the Bottom each represent a distinct biological replicate and are representative of multiple independent experiments. (B and C) Samples prepared in A are compared for frequency of cDCs as a proportion of all singlet lymphocytes (B) and for frequency of CD24+ cDCs and Sirp-α+ cDCs as a proportion of cDCs (C). Shown is a table (B) and representative two-color histograms (C). Numbers in C indicate the percentage of cells within the indicated gate. (D) Samples prepared from the indicated organs, harvested from mice of the indicated genotypes 7–9 d after administration of poly(I:C), are compared for frequency of pDCs. Shown is a plot displaying frequency of pDCs as a proportion of all singlet lymphocytes. Dots each represent a distinct biological replicate and are representative of multiple independent experiments. (E) Samples prepared from the indicated organs, harvested from mice of the indicated genotypes 1 y after administration of poly(I:C), are compared for frequency of pDCs. Shown are representative two-color histograms (n = 3 mice per group pooled over two independent, consecutive experiments). Numbers indicate the percentage of cells within the indicated gate. (F) Samples prepared in D are compared for frequency of cDCs as in C. res., resident.

Short-term inducible deletion and CD11c-Cre–driven conditional deletion of Zeb2 do not change spleen or BM cellularity. Samples prepared from the spleen and BM and harvested from mice of the indicated genotypes are compared for cell count. Mice at the Top were treated with poly(I:C) 7–9 d before analysis. Shown are plots of the number of viable cells obtained from whole spleen (Left) or one femur (Right) after red blood cell lysis. Dots each represent a distinct biological replicate pooled from multiple independent experiments.
We overexpressed Zeb2 by retroviral transduction in Kithi BM progenitors cultured in the presence of Flt3L (Fig. 2A). Transduction efficiency was consistently lower for Zeb2-expressing retrovirus compared with control retrovirus, yet the transduced fraction showed markedly increased frequency of pDCs with no detectable change in the ratio of CD24:Sirp-α cDCs (Fig. 2A). To test whether the requirement for Zeb2 was intrinsic to developing pDCs, we mixed CD45.1+CD45.2+ Zeb2+/− BM cells with CD45.1+CD45.2− wild-type (WT) BM cells and cultured them in vitro in the presence of the cytokine Flt3L. In this setting, we observed that Zeb2 haploinsufficiency produced a partial defect in the development of pDCs, whereas we observed no defect in Sirp-α+ cDC development from Zeb2-haploinsufficient BM (Fig. 2B). We used another model of conditional Zeb2 deletion driven by the 4-hydroxytamoxifen (4-OHT)–inducible Gt(ROSA)26Sor-Cre-ERT2 (R26-iCre) to study the effect of complete Zeb2 deficiency in vitro. As expected, 4-OHT treatment eliminated pDC development in Flt3L-treated cultures of Zeb2fl/fl;R26iCre/iCre BM but did not perturb pDC development in cultures of WT BM (Fig. 2C). Next, we analyzed the development of CD19−Ly-6G−KithiFlt3+ progenitors in the presence of Flt3L and 4-OHT, mixing CD45.2+ Zeb2fl/fl;R26iCre/iCre cells with congenically marked CD45.1+ Zeb2-sufficient cells (B6.SJL) (Fig. 2D). We observed that Zeb2-deficient progenitors were unable to support substantial pDC development, but CD24+ cDCs and Sirp-α+ cDCs developed from both Zeb2-deficient and Zeb2-sufficient progenitors (Fig. 2D). Thus, the selective requirement for Zeb2 in pDC but not cDC development was cell-intrinsic to progenitors.

Plasmacytoid DCs require Zeb2 in a dose-dependent and cell-intrinsic manner. (A) Single-cell suspensions of Kithi BM progenitors isolated from WT mice were cultured in the presence of Flt3L and then retrovirally transduced 1 d later to overexpress Thy1.1 alone (Empty RV) or Zeb2 and Thy1.1 (Zeb2 RV). Shown are two-color histograms comparing pDC and cDC frequencies among transduced (Thy1.1+) cells or 7 d after transduction. Data are representative of at least two independent experiments. (B) Single-cell suspensions of whole BM isolated from WT or Zeb2+/− mice were mixed with congenically marked (CD45.1+ CD45.2−) single-cell suspensions of whole BM isolated from WT B6.SJL mice and cultured in the presence of Flt3L. Shown is the proportion of cells expressing CD45.2 (blue) or not expressing CD45.2 (orange) among progeny within the indicated subsets. (C) Single-cell suspensions of whole BM isolated from mice of the indicated genotypes were cultured in the presence of Flt3L (FL) and either 100 nM 4-OHT dissolved in ethanol or ethanol alone (vehicle). Shown are representative two-color histograms comparing a proportion of Siglec-H+ pDCs among progeny after 9 d of culture (n > 2 biological replicates per group over at least two independent experiments). (D) BM Kithi Flt3+ progenitors isolated from R26iCre/+ mice or Zeb2fl/fl;R26iCre/iCre mice were mixed with congenically marked (CD45.1+) BM Kithi Flt3+ progenitors isolated from WT B6.SJL mice and cultured in the presence of Flt3L and 4-OHT. Shown are two-color histograms comparing the proportion of cells within the indicated subsets expressing CD45.1 or CD45.2.
We also examined the effect of complete Zeb2 deficiency on DC development in vitro using the type I IFN-inducible Mx1-Cre system because type I IFN itself can induce pDC death (37) or promote pDC development (38, 39). We cultured CD19−Ly-6G−KithiFlt3+ progenitors in vitro with Flt3L and in the absence or presence of IFN-α. In this setting, Zeb2-sufficient progenitors skewed away from CD24+ cDC development and toward pDC development (Fig. 3A). However, IFN-α treatment of Zeb2fl/fl;Mx1-Cre(tg) progenitors diverted progenitors toward CD24+ cDC development with nearly complete loss of pDCs and substantial loss of Sirp-α+ cDCs (Fig. 3A). Mixed cultures of Zeb2-sufficient and Zeb2fl/fl;Mx1-Cre(tg) progenitors showed that this action of Zeb2 was cell-intrinsic because Zeb2-sufficient cells contributed exclusively to pDC development and to the majority of Sirp-α+ cDC development, whereas Zeb2-deficient progenitors were the predominant source of CD24+ cDCs (Fig. 3B). Thus, loss of Zeb2 in DC progenitors treated with IFN-α not only abrogated development of pDCs but diverted progenitors to the CD24+ cDC lineage at the expense of Sirp-α+ cDC development.
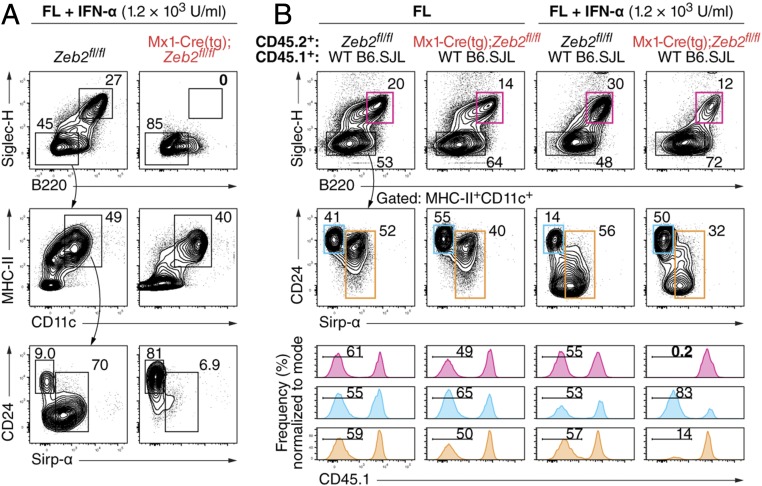
Type I IFN diverts Zeb2-deficient progenitors to the CD24+ cDC lineage. (A) BM Kithi Flt3+ progenitors isolated from mice of the indicated genotypes were cultured in the presence of Flt3L (FL) and IFN-α. Shown are representative two-color histograms comparing progeny of those isolated cells as analyzed after 7–7.5 d of culture (n ≥ 3 biological replicates per group over two independent experiments). (B) BM Kithi Flt3+ progenitors isolated as in A were mixed with congenically marked (CD45.1+) BM Kithi Flt3+ progenitors isolated from WT B6.SJL mice and cultured as in A. Shown are representative two-color histograms comparing their progeny as analyzed after 7 d of culture (Top) and one-color histograms indicating the proportion of pDCs (magenta), CD24+ cDCs (cyan), and Sirp-α+ cDCs (orange) lacking expression of CD45.1 (n ≥ 3 biological replicates per group over two independent experiments). In all panels, numbers indicate the percentage of cells within the indicated gate.
We examined targets of Zeb2 regulated during DC development by gene expression microarray analysis of WT and CD11c-Cre–driven Zeb2-deficient splenic Sirp-α+ cDCs (Fig. 4). Few genes showed more than a threefold change between groups. Among those were Itgad, which encodes CD11d and is part of the CD11c-Cre transgenic integration (14), and Ms4a1, which encodes CD20 (Fig. S2A). Expression of Lyz2 (encoding lysozyme) was decreased more than twofold and that of Csf1r (encoding M-CSFR) was halved in Zeb2-deficient Sirp-α+ cDCs compared with WT (Fig. 4A and Fig. S2A). Of transcription-factor–encoding genes, Ifi203 and Id2 were each increased in expression less than twofold in Zeb2-deficient Sirp-α+ cDCs compared with WT (Fig. 4B). By reverse transcription quantitative PCR (RT-qPCR), we confirmed that Id2 expression was increased in CD11c-Cre–driven Zeb2-deficient Sirp-α+ cDCs compared with WT Sirp-α+ cDCs (Fig. 4C).
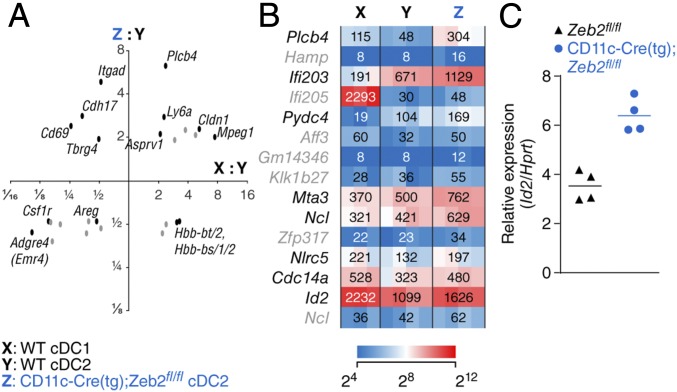
Zeb2-deficient Sirp-α+ cDCs express more abundant Id2 mRNA. (A) Scatterplot comparing changes in gene expression between Zeb2-deficient Sirp-α+ cDCs and WT Sirp-α+ cDCs (y axis) to changes in gene expression between WT CD24+ cDCs and WT Sirp-α+ cDCs (x axis). Both axes are logarithmic, and probe sets with less than 1.9-fold changes in expression along either dimension are omitted for clarity. (B) Heat map showing relative expression in the indicated populations as determined by gene expression microarray analysis, filtered for probe sets assigned to genes encoding nuclear protein products with the greatest increase in expression in Zeb2-deficient Sirp-α+ cDCs compared with WT Sirp-α+ cDCs. In A and B, probe sets in gray have scant expression (linear normalized value < 64) in Zeb2-deficient Sirp-α+ cDCs (n ≥ 3 biological replicates per group pooled over two independent experiments). (C) Plot showing relative expression of Id2 mRNA normalized to Hprt mRNA in Sirp-α+ cDCs isolated from mice of the indicated genotypes as determined by RT-qPCR; each dot represents a biological replicate averaged from technical replicates.
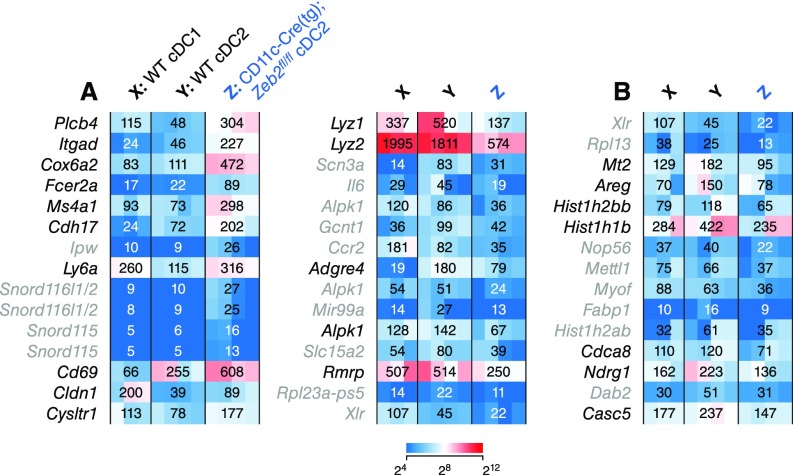
Zeb2-deficient cDC2s show differences in gene expression from WT cDC2s. (A) Heat maps showing relative expression in the indicated populations as determined by gene expression microarray analysis for probe sets assigned to annotated genes with the greatest increase (Left) or decrease (Right) in expression in Zeb2-deficient Sirp-α+ cDCs compared with WT Sirp-α+ cDCs. (B) Heat map as in A filtered for probe sets assigned to genes encoding nuclear protein products with the greatest decrease in expression in Zeb2-deficient Sirp-α+ cDCs compared with WT Sirp-α+ cDCs. In A and B, probe sets in gray show scant expression (linear normalized value < 64) in Zeb2-deficient Sirp-α+ cDCs (n ≥ 3 biological replicates per group pooled over two independent experiments).
Because Ifi204 encodes a protein known to antagonize the function of Id2 by cytoplasmic translocation (40, 41), we overexpressed Ifi204 in BM cultured in the presence of Flt3L and analyzed its effect on DC development. However, expression of Ifi204 induced no substantial change in the frequency of pDCs or cDCs (Fig. S3A). Because Zeb2 promotes transcription of Smad7 in the central nervous system (24), we also overexpressed Smad7 in BM cultured in the presence of Flt3L. Again, however, we observed no substantial change in the relative frequency of DC subsets (Fig. S3B).
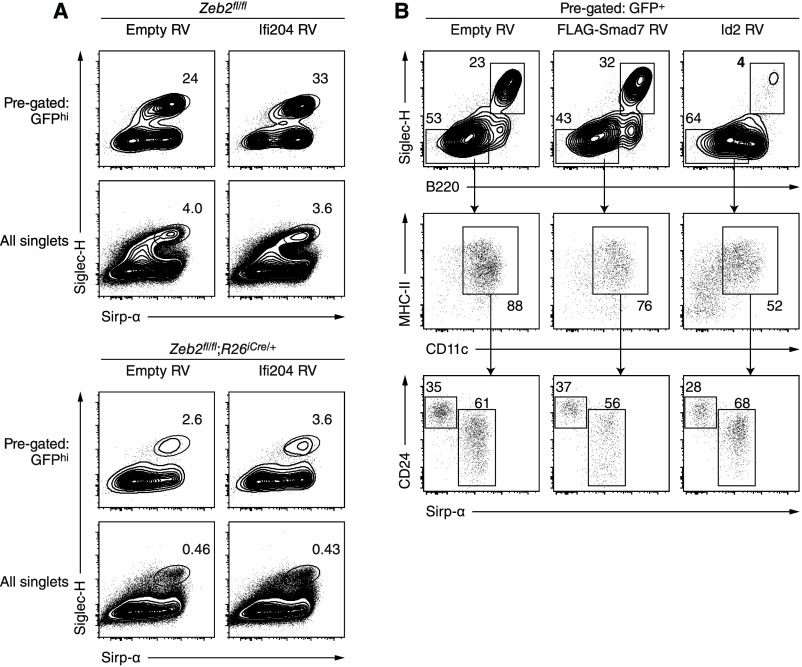
Overexpression of Ifi204 or Smad7 does not promote development of pDCs. (A) Single-cell suspensions of whole BM isolated from mice of the indicated genotypes were cultured in the presence of Flt3L and 4-OHT and then retrovirally transduced 2–3 d later to overexpress GFP alone (Empty RV) or Ifi204 and GFP (Ifi204 RV). Shown are two-color histograms comparing pDC frequency among transduced (GFPhi) cells or all cells 6 d after transduction. (B) Single-cell suspensions of Zeb2-sufficient BM were cultured in the presence of Flt3L and then retrovirally transduced 2 d later to overexpress GFP alone (Empty RV), N-terminally FLAG-tagged Smad7 and GFP (FLAG-Smad7 RV), or Id2 and GFP (Id2 RV). Shown are two-color histograms comparing pDC and cDC frequency among transduced (GFP+) cells 6 d after transduction.
Using the type I IFN-inducible Mx1-Cre system, we also observed long-term changes in the development of other myeloid lineages after deletion of Zeb2. Poly(I:C) treatment induced transient loss of Ly-6Chi blood monocytes in both Zeb2fl/fl;Mx1-Cre(tg) mice and Zeb2fl/fl control mice; however, monocytes were restored to pretreatment frequencies within 3 d in control mice but remained depleted in Zeb2fl/fl;Mx1-Cre(tg) mice (Fig. 5A). Similarly, monocytes were depleted in the BM and spleen of Zeb2fl/fl;Mx1-Cre(tg) mice compared with Zeb2fl/fl control mice 1 wk after poly(I:C) treatment (Fig. S4). By contrast, neutrophil frequency was not decreased in Zeb2-deficient mice (Fig. S4). We found that depletion of monocytes persisted for at least 1 y after poly(I:C)-induced Zeb2 deletion (Fig. 5B). Consistent with these observations, the frequency of M-CSFR+ cells in the BM was substantially decreased after Mx1-Cre–driven Zeb2-deletion (Fig. 5C). By contrast, the frequency of GMPs (Lin−Sca1−Kit+FcγRII/III+) was not decreased 1 wk after Mx1-Cre–driven Zeb2 deletion compared with Zeb2-sufficient control mice (Fig. 5C). Using a Zeb2-GFP fusion protein reporter mouse (42), we found that Zeb2 was expressed in all Lin−M-CSFR+ cells in the BM, supporting the notion that Zeb2 may be required for M-CSFR expression (Fig. S5).

Zeb2 is required for monocyte development in vivo. (A) Blood from Zeb2fl/fl and Zeb2fl/fl;Mx1-Cre(tg) mice is compared for neutrophil and monocyte frequency before and after administration of poly(I:C). Shown are two-color histograms analyzed on the indicated days. Numbers indicate the percentage of cells within the indicated gate. (B) Blood from poly(I:C)-treated mice of the indicated genotypes are compared using two gating schemes for monocyte frequency 1 y after administration of poly(I:C). Shown are representative two-color histograms (n = 3 mice per group pooled over two independent, consecutive experiments). Numbers indicate percentage of cells within the indicated gate. (C) BM from poly(I:C)-treated mice are compared for M-CSFR expression and frequency of GMPs (identified as Lin− Sca-1− Kit+ FcγRII/III+) 7–9 d after treatment. Shown are representative two-color histograms (Top) and a plot displaying frequency of cells identified by the indicated surface markers as a proportion of all singlet lymphocytes (Bottom). Numbers at Top indicate percentage of cells within the indicated gate; dots at Bottom each represent a distinct biological replicate and are pooled from independent experiments.

Zeb2 is required for monocyte development in the spleen and BM. BM and spleen from poly(I:C)-treated mice of the indicated genotypes are compared for monocyte (mo.) frequency 7–9 d after treatment. Shown are two-color histograms for representative BM samples (Left) and plots displaying frequency of the indicated subsets as a proportion of all singlet lymphocytes (Right). Numbers at Left indicate percentage of cells within the indicated gate; dots at Right each represent a distinct biological replicate and are pooled from independent experiments.
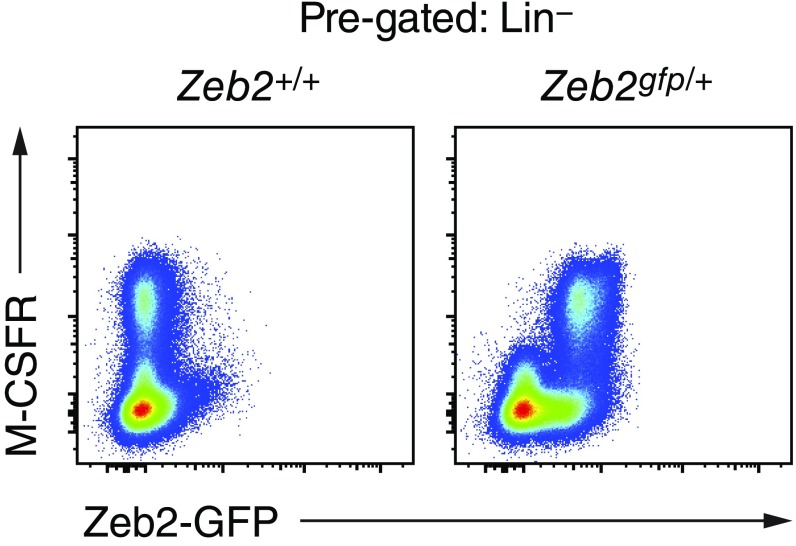
Zeb2 is expressed in all M-CSFR+ progenitor cells in the BM. BM samples from Zeb2+/+ or Zeb2gfp/+ mice are compared for Zeb2-GFP expression among Lin (CD19, CD105, Ly-6G, Ter-119)− cells. Shown are two-color histograms for representative samples (n ≥ 3 biological replicates per group pooled over at least two independent experiments).
To determine if commitment to the monocyte lineage was impaired by loss of Zeb2, we used gene expression microarrays to compare neutrophils and Ly-6Chi monocytes from Zeb2fl/fl control mice or poly(I:C)-treated Zeb2fl/fl;Mx1-Cre(tg) mice (Fig. 6A). Although Zeb2-deficient and Zeb2-sufficient neutrophils were nearly indistinguishable from each other, residual Ly-6Chi monocytes developing in poly(I:C)-treated Zeb2fl/fl;Mx1-Cre(tg) mice showed increased expression of numerous genes compared with Zeb2-sufficient Ly-6Chi monocytes (Fig. 6A). In particular, Zeb2-deficient Ly-6Chi monocytes showed increased expression of ~50 genes that as a group are characteristic of WT neutrophils (Fig. 6B). For example, Ltf (encoding lactotransferrin), Mmp9 (encoding matrix metallopeptidase 9), and Camp (encoding cathelicidin antimicrobial peptide) were more abundantly expressed in Zeb2-deficient Ly-6Chi monocytes and in WT neutrophils than in WT Ly-6Chi monocytes. Zeb2-deficient Ly-6Chi monocytes also showed increased expression of several genes characteristic of the GMP (43) and not highly expressed in neutrophils (Fig. 6 B–D). For example, Mpo (encoding myeloperoxidase), Elane (encoding neutrophil-expressed elastase; the transcript is not highly expressed in neutrophils), and Prtn3 (encoding proteinase 3) were more abundantly expressed in Zeb2-deficient Ly-6Chi monocytes compared with WT Ly-6Chi monocytes and neutrophils (Fig. 6C), and they are also more abundantly expressed in GMPs than in Ly-6Chi monocytes or neutrophils (Fig. 6D).

Zeb2-deficient Ly-6Chi monocytes express neutrophil-associated genes. (A) Volcano plots showing changes in gene expression between Zeb2-deficient and Zeb2-sufficient Ly-6Chi monocytes (mo.) or between Zeb2-deficient and Zeb2-sufficient neutrophils, all isolated from poly(I:C)-treated mice. (B) Scatterplot comparing changes in gene expression between Zeb2-deficient Ly-6Chi monocytes and Zeb2-sufficient Ly-6Chi monocytes (y axis) to changes in gene expression between Zeb2-sufficient neutrophils and Zeb2-sufficient Ly-6Chi monocytes (x axis). Compared with their expression in Zeb2-sufficient monocytes, some probe sets are more abundantly expressed in Zeb2-deficient monocytes but not in Zeb2-sufficient neutrophils (solid green), more abundantly expressed in Zeb2-sufficient neutrophils but not in Zeb2-deficient monocytes (solid red), or more abundantly expressed both in Zeb2-deficient monocytes and in Zeb2-sufficient neutrophils (dashed yellow). Numbers in each outlined region indicate absolute probe set count. (C) Heat map showing relative expression of 22 probe sets outlined in B (solid green) among the indicated populations. (D) Relative expression of nine probe sets clustered in C among the indicated populations in the BM (data from ImmGen). (E) Sparklines showing relative expression of transcription-factor–encoding genes more (Top) or less (Bottom) abundantly expressed in Zeb2-deficient Ly-6Chi monocytes than in Zeb2-sufficient Ly-6Chi monocytes. In all panels, results shown are from at least four biological replicates in each group pooled over two independent experiments.
The transcription-factor–encoding genes Id2 and Myc are each increased in expression in Zeb2-deficient Ly-6Chi monocytes compared with Zeb2-sufficient Ly-6Chi monocytes (Fig. 6E). Other transcription factor–encoding genes such as Cebpe and Zeb1 also showed increased expression in Zeb2-deficient Ly-6Chi monocytes compared with Zeb2-sufficient counterparts and are also more highly expressed in neutrophils than in Zeb2-sufficient Ly-6Chi monocytes. Several transcription-factor–encoding genes were expressed less abundantly in Zeb2-deficient Ly-6Chi monocytes than in Zeb2-sufficient Ly-6Chi monocytes, including Tcf4, Prdm1 (also known as Blimp1), Klf4 [a target of Irf8 essential for monocyte development (44–46)], Irf4, Fosb, and Atf3 (Fig. 6E).
In summary, deletion of Zeb2 resulted in loss of M-CSFR expression in the BM and in the long-term ablation of Ly-6Chi monocytes. Residual Ly-6Chi monocytes that develop in the absence of Zeb2 showed increased expression of Id2 along with expression of genes more characteristic of neutrophils or GMPs.
Discussion
Here, we describe an action of Zeb2 in promoting M-CSFR expression and repressing expression of neutrophil genes in favor of monocyte development. After inducing deletion of Zeb2, we observed severe loss of M-CSFR expression on progenitor cells in the BM and a long-term impairment of monocyte development in the peripheral blood. Residual Zeb2-deficient Ly-6Chi monocytes showed increased expression of Id2 compared with WT Ly-6Chi monocytes, and they expressed genes characteristic of WT neutrophils and GMPs. These findings agree with previous reports that Id2 represses PU.1-mediated induction of Csf1r (47) and that M-CSFR–deficient (op/op) mice have severely decreased blood monocyte frequency (48).
In agreement with a recent study (18), we confirm a requirement for Zeb2 in the development of pDCs. We observed that deletion of Zeb2 abrogated pDC development in vitro and in vivo. We also found that expression of Id2 was increased in cDC2s lacking Zeb2 in agreement with previous studies (18, 24). Because Id2 overexpression inhibits pDC development (49), and because the balance between Id2 and E2-2 regulates the ratio of cDC1s to pDCs (32–34), our evidence supports a model in which Zeb2 regulates the choice between pDC and cDC1 fate through repression of Id2 (Fig. S6).
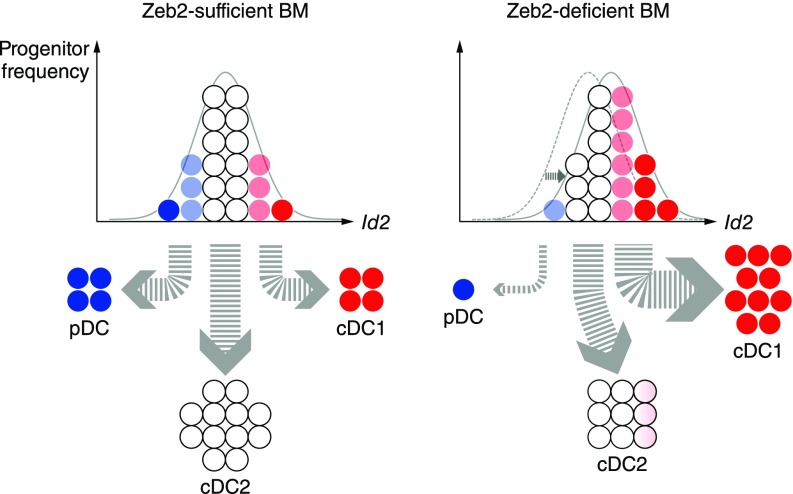
Id2 expression and DC subset frequency are modulated by Zeb2. In a model of DC development in the BM, derepression of Id2 due to Zeb2 deficiency alters the balance between Id2 and E2-2, increasing cDC1 output and decreasing pDC output.
Previously, the similarly incomplete abrogation of pDC and cDC2 development resulting from CD11c-Cre–driven Zeb2 deletion suggested a role for this transcription factor in commitment to both lineages (18). Using inducible systems to delete Zeb2 in early progenitors, we observed that Zeb2 was not essential for cDC2 lineage specification and survival. Instead, we found only a twofold decrease in cDC2 frequency in Zeb2-deficient mice that showed abrogation of pDC development. Furthermore, Zeb2-deficient cDC2s closely resembled their WT counterparts in global gene expression. Moreover, because cDC2s appear to persist normally in Id2-deficient mice (30, 36), defects in their development would not be expected to arise from changes in expression of Id2. As such, our results are more consistent with the interpretation that Zeb2 control of Id2 expression regulates specification between pDC and cDC1 fates.
Addition of type I IFN substantially increased the pDC output of WT Kithi progenitors in vitro. The cytokine itself can either induce pDC death (37) or promote pDC development (38, 39), and our observation raises the possibility that a developmental feed-forward loop could promote pDC development in the context of viral infection. Such a mechanism would potentiate the well-studied molecular feed-forward loop that promotes type I IFN production (50, 51). In contrast, treatment of Zeb2fl/fl;Mx1-Cre(tg) Kithi progenitors with type I IFN diverted nearly all progenitors to the cDC1 fate. This observation is not explained by selective death of pDCs and cDC2s because we observed that Zeb2-deficient progenitors outcompete WT progenitors in generating cDC1s in mixed cultures. Thus, pDC development requires cell-intrinsic Zeb2 expression and is not compensated by type I IFN signaling. Instead, Zeb2 acts to repress specification of progenitors to the cDC1 fate under these conditions.
Taken together, our findings suggest that Zeb2 activity may engage similar mechanisms to suppress alternative fates in multiple developing lineages. As lymphoid progenitors not presented here express and require Zeb2 (28), those cells and their progeny represent further avenues to explore the mechanisms by which this transcription factor regulates the development of immune lineages.
Materials and Methods
Mice carrying the conditional Zeb2fl [B6;129(Cg)-Zfhx1btm1.1Yhi] allele (22) were derived from biological material provided by the RIKEN BioResource Center through the National BioResource Project of the Ministry of Education, Culture, Sports, Science and Technology, Japan. Other mouse strains were obtained from The Jackson Laboratory as described in SI Materials and Methods. Mice were bred and maintained in a specific-pathogen–free animal facility according to institutional guidelines and under protocols approved by the Animal Studies Committee of Washington University in St. Louis.
Flow cytometry samples were stained in magnetic-activated cell-sorting (MACS) buffer at 4 °C and, unless staining for FcγRII/III, in the presence of Fc Block (2.4G2, BD Biosciences). Antibodies and other reagents were purchased as described in SI Materials and Methods. Cells were analyzed using a FACSCanto II, LSR II, LSR Fortessa, FACSAria II, or FACSAria Fusion flow cytometer (BD), and data were analyzed using FlowJo software (FlowJo). All gating strategies incorporated size and doublet discrimination based on forward and side scatter parameters.
Induction of gene deletion, cell preparation, cell culture, microarray analysis, and RT-qPCR were performed as described in SI Materials and Methods.
SI Materials and Methods
Mice.
B6.SJL (B6.SJL-Ptprca Pepcb/BoyJ) mice (stock no. 002014), CD11c-Cre [B6.Cg-Tg(Itgax-cre)1–1Reiz/J] mice (stock no. 008068), Mx1-Cre [B6.Cg-Tg(Mx1-cre)1Cgn/J] mice (stock no. 003556), and R26iCre/iCre [B6.129-Gt(ROSA)26Sortm1(cre/ERT2)Tyj/J] mice (stock no. 008463) were obtained from The Jackson Laboratory.
Constitutively heterozygous Zeb2+/− mice were generated by breeding Zeb2fl/fl mice to CMV-Cre [B6.C-Tg(CMV-cre)1Cgn/J] mice (The Jackson Laboratory, stock no. 006054) and then interbreeding progeny and screening for Cre-negative Zeb2+/− mice for further interbreeding or for breeding to WT C57BL/6 or B6.SJL mice.
Zeb2-GFP fusion protein reporter (STOCK Zfhxlbtm2.1Yhi) mice (42) were derived from biological material provided by the RIKEN BioResource Center through the National BioResource Project of the Ministry of Education, Culture, Sports, Science and Technology, Japan.
Antibodies and Flow Cytometry.
The following antibodies purchased from BD Biosciences, BioLegend, eBioscience, or Tonbo Biosciences were used to detect surface markers by flow cytometry: anti-CD3 (17A2) conjugated to eFluor (eF) 450; anti-CD3e (145-2C11) conjugated to biotin or PE; anti-CD4 (RM4-5) conjugated to PE-Cy7 or PerCP-Cy5.5; anti-CD8a (53-6.7) conjugated to Brilliant Violet (BV) 510, FITC, or V500; anti-CD11b (M1/70) conjugated to biotin, eF450, FITC, PE-Cy7, or PerCP-Cy5.5; anti-CD11c (N418) conjugated to Alexa Fluor (AF) 488, APC-Cy7, APC-eF780, biotin, or PerCP-Cy5.5; anti-FcγRII/III (2.4G2) conjugated to FITC; anti-CD19 (1D3) conjugated to APC-Cy7, biotin, or FITC; anti-CD23 (B3B4) conjugated to PE-Cy7; anti-CD24 (M1/69) conjugated to PE-Cy7; anti-CD25 (PC61) conjugated to APC or PE-Cy7; anti-CD41 (eBioMWReg30) conjugated to PE; anti-CD43 (S7) conjugated to APC or PE; anti-CD44 (IM7) conjugated to APC or APC-eF780; anti-CD45 (30-F11) conjugated to eF450; anti-CD45.1 (A20) conjugated to BV711 or FITC; anti-CD45.2 (104) conjugated to APC, APC-eF780, PE, or PerCP-Cy5.5; anti-B220 (RA3-6B2) conjugated to BV510, eF450, PE-Cy7, PerCP-Cy5.5, or V500; anti-CD64 (X54-5/7.1) conjugated to AF647; anti-Thy1.1 (OX-7) conjugated to PE; anti-C1qRp (AA4.1) conjugated to APC or PE; anti-CD103 (2E7) conjugated to PE; anti-CD105 (MJ7/18) conjugated to eF450 or PE-Cy7; anti–M-CSFR (AFS98) conjugated to BV711 or PE; anti-Kit (2B8) conjugated to APC-eF780, biotin, Brilliant UV 395, or PE-Cy7; anti-Kit (ACK2) conjugated to APC-eF780; anti–IL-7Ra (SB/199) conjugated to BV421; anti-Flt3 (A2F10.1) conjugated to APC or PE-CF594; anti-PDGFRβ (APB5) conjugated to APC; anti-CD150 (mShad150) conjugated to APC; anti-CD150 (TC15-12F12.2) conjugated to AF647; anti-NK1.1 (PK136) conjugated to biotin, eF450, FITC, or V450; anti–Sirp-α (P84) conjugated to APC or PerCP-eF710; anti-CD199 (CCR9; CW-1.2) conjugated to PE-Cy7; anti–DEC-205 (NLDC-145) conjugated to AF647 or APC; anti-Bst2 (eBio927) conjugated to APC; anti-F4/80 (BM8) conjugated to APC; anti-FcεRI (MAR-1) conjugated to PE; anti-IgD (11–26) conjugated to PE; anti-IgM (II/41) conjugated to PerCP-eF710; anti–Ki-67 (B56) conjugated to AF647; anti–Sca-1 (D7) conjugated to biotin, PerCP-Cy5.5, or PE-Cy7; anti–Ly-6C (AL-21) conjugated to AF700, APC, or FITC; anti–Ly-6C (HK1.4) conjugated to AF488 or APC-eF780; anti–Ly-6D (49-H4) conjugated to PE; anti–Ly-6G (1A8) conjugated to FITC, PE, or PerCP-Cy5.5; anti–Gr-1 (RB6-8C5) conjugated to biotin, eF450, or V450; anti–TER-119 conjugated to eF450 or PE-Cy7; anti–MHC-II (M5/114.15.2) conjugated to AF488, BV421, BV510, eF450, Pacific Blue (PB), V500, or violetFluor 450; anti–Siglec-F (E50-2440) conjugated to AF647; anti–Siglec-H (551) conjugated to PE; anti–Siglec-H (eBio440c) conjugated to PerCP-eF710; and anti-TCRβ (H57-597) conjugated to PE. Anti-F4/80 antibody (MF48028) conjugated to APC or PB was purchased from Invitrogen; streptavidin conjugated to eF450 or BV510 was purchased from eBioscience or BD Biosciences, respectively; and 7-AAD viability dye was purchased from BioLegend.
Induced Gene Deletion.
Gene deletion in Zeb2fl/fl;Mx1-Cre(tg) mice was induced by i.p. injection of 100–150 μg poly(I:C) (Sigma-Aldrich; 1.0 mg/mL stock solution dissolved in saline) either once (Fig. 5A) or twice within 36–72 h (all other experiments). Gene deletion in cultures of Zeb2fl/fl;Mx1-Cre(tg) cells was induced by addition of 1.2 × 10³ U/mL mouse IFN-α (Gibco; 1.82 × 10⁶ U/mL stock solution dissolved in PBS + 0.1% BSA). Gene deletion in cultures of Zeb2fl/fl;R26iCre/iCre cells was induced by addition of 100–150 nM 4-OHT (50:50 mixture of E/Z enantiomers, Sigma-Aldrich; 100 μM stock solution dissolved in ethanol).
Cell Preparation.
Cheek pouch (submandibular) blood samples were collected using Microvette capillaries (Sarstedt) or Microtainer Tubes with EDTA (BD) after venipuncture using a 4-mm Golden Rod Animal Lancet (MEDIpoint) following manufacturer’s instructions. Spleen samples were minced and digested in Iscove’s modified Dulbecco’s medium + 10% (vol/vol) FCS (cIMDM) supplemented with 250 µg/mL collagenase B (Roche) and 30 U/mL DNase I (Sigma-Aldrich) for 30 min to 1 h at 37 °C with stirring; LN samples were digested in the same manner without mincing. BM samples were obtained by flushing the femur (or both the femur and the tibia) with MACS buffer (PBS + 0.5% BSA + 2 mM EDTA).
Cell Culture.
Single-cell suspensions of whole BM were diluted to a concentration of 2 × 10⁶ cells/mL and cultured in the presence of Flt3L for 9–10 d. Sorted progenitors (fewer than 1 × 10⁵ cells per sample) were cultured in individual wells of a 96-well U-bottom plate in the presence of Flt3L for 7–7.5 d.
For overexpression studies, Ifi204 coding sequence was amplified from a cDNA library synthesized from monocyte mRNA and ligated into the pMSCV IRES-GFP retroviral overexpression vector; frameshift errors in the resulting plasmid were corrected by excision of flanking sequence and ligation of a replacement synthetic DNA fragment (Integrated DNA Technologies). A sequence encoding FLAG-tagged Smad7 was amplified from the pBabe Flag Smad7 plasmid (Addgene #14836) and ligated into the pMSCV IRES-GFP retroviral overexpression vector. Purified retroviral overexpression vectors were transfected into Phoenix-E cells using the calcium phosphate method or using Lipofectamine 3000 (Invitrogen) following manufacturer’s instructions. Viral supernatants were harvested at 2 and 3 d after transfection, filtered, and concentrated by centrifugation and then applied to cell cultures that were subsequently centrifuged at 2,000 × g for 1 h after addition of 2 μg/mL polybrene.
Microarray Analysis.
CD24+ cDCs and Sirp-α+ cDCs were sorted from cells harvested from the spleen, and Ly-6Chi monocytes and neutrophils were sorted from cells harvested from the BM. RNA was isolated from cells using an RNAqueous-Micro Kit (Ambion) and submitted for amplification, labeling, and hybridization to Mouse Gene 1.0 ST Arrays (Affymetrix). Expression values were analyzed after RMA quantile normalization using ArrayStar 4 or ArrayStar 5 software (DNASTAR).
RT-qPCR.
For each biological replicate, 2.5 × 10⁵ Sirp-α+ cDCs were sorted from the spleen of a distinct mouse, and RNA was isolated using an EZNA MicroElute Total RNA Kit (Omega Bio-tek). First-strand cDNA was synthesized using oligo(dT)25 primer and SuperScript III Reverse Transcriptase enzyme (Invitrogen). Quantitative analysis was performed using the LightCycler 480 System (Roche) with Luminaris Color HiGreen qPCR Master Mix (Thermo Fisher) and the following primer pairs: Id2, 5′-GCATCCCACTATCGTCAGCC-3′ and 5′-AAGGGAATTCAGATGCCTGC-3′; Hprt (PrimerBank ID 7305155a1), 5′-TCAGTCAACGGGGGACATAAA-3′ and 5′-GGGGCTGTACTGCTTAACCAG-3′.
ChIP-qPCR.
BM cells were cultured for 9 d in the presence of Flt3L, then harvested, fixed using paraformaldehyde, and stained for surface marker expression; CD24+ cDCs and Sirp-α+ cDCs were sorted and chromatin was sonicated and immunoprecipitated using rabbit polyclonal anti-Zeb2 antibody (sc-48789, Santa Cruz). Quantitative analysis was performed using the LightCycler 480 System (Roche) with Luminaris Color HiGreen qPCR Master Mix (Thermo Fisher) and the following primer pairs: Id2 promoter (24), 5′-CGCGGTAATCAGAAGCAGGTT-3′ and 5′-TGCAGAGAAGACCTTGAGACTC-3′; Id2 putative enhancer (based on presence of consensus binding motif), 5′-GTGTCAGGGGAGAGGAAACAC-3′ and 5′-GGGACAAGAGGTACGAGTATGT-3′.
Acknowledgments
We thank J. Michael White and the technical staff of the Transgenic Knockout Micro-Injection Core in the Department of Pathology and Immunology at Washington University School of Medicine for mouse rederivation and the Genome Technology Access Center in the Department of Genetics at Washington University School of Medicine. The Genome Technology Access Center is partially supported by National Cancer Institute Cancer Center Support Grant P30 CA91842 to the Siteman Cancer Center and by Institute of Clinical and Translational Sciences/Clinical & Translational Science Award Grant UL1 TR000448 from the National Center for Research Resources, a component of the NIH, and by NIH Roadmap for Medical Research. This work was supported by the Howard Hughes Medical Institute (K.M.M.), NIH Grants 1K08AI106953 (to M.H.) and 1F31CA189491-01 (to G.E.G.-R.), American Heart Association Grant 12PRE12050419 (to W.K.), and the Burroughs Wellcome Fund Career Award for Medical Scientists (to M.H.).
Footnotes
The authors declare no conflict of interest.
Data deposition: Gene expression microarray data have been deposited in the Gene Expression Omnibus (accession nos. GSE87882, GSE87883, and GSE87884).
This article contains supporting information online at www.pnas.org/lookup/suppl/10.1073/pnas.1611408114/-/DCSupplemental.
References
Articles from Proceedings of the National Academy of Sciences of the United States of America are provided here courtesy of National Academy of Sciences
Full text links
Read article at publisher's site: https://doi.org/10.1073/pnas.1611408114
Read article for free, from open access legal sources, via Unpaywall:
https://www.pnas.org/content/pnas/113/51/14775.full.pdf
Citations & impact
Impact metrics
Citations of article over time
Alternative metrics
Smart citations by scite.ai
Explore citation contexts and check if this article has been
supported or disputed.
https://scite.ai/reports/10.1073/pnas.1611408114
Article citations
Dominant immune tolerance in the intestinal tract imposed by RelB-dependent migratory dendritic cells regulates protective type 2 immunity.
Nat Commun, 15(1):9143, 23 Oct 2024
Cited by: 0 articles | PMID: 39443450 | PMCID: PMC11500181
Evaluating in vivo approaches for studying the roles of thymic DCs in T cell development in mice.
Front Immunol, 15:1451974, 06 Aug 2024
Cited by: 0 articles | PMID: 39165362 | PMCID: PMC11333248
Review Free full text in Europe PMC
TRIM33 plays a critical role in regulating dendritic cell differentiation and homeostasis by modulating Irf8 and Bcl2l11 transcription.
Cell Mol Immunol, 21(7):752-769, 31 May 2024
Cited by: 0 articles | PMID: 38822080
CaSSiDI: novel single-cell "Cluster Similarity Scoring and Distinction Index" reveals critical functions for PirB and context-dependent Cebpb repression.
Cell Death Differ, 31(3):265-279, 21 Feb 2024
Cited by: 1 article | PMID: 38383888
Regulation of pDC fate determination by histone deacetylase 3.
Elife, 12:e80477, 27 Nov 2023
Cited by: 3 articles | PMID: 38011375 | PMCID: PMC10732571
Go to all (41) article citations
Data
Data behind the article
This data has been text mined from the article, or deposited into data resources.
BioStudies: supplemental material and supporting data
GEO - Gene Expression Omnibus (3)
- (1 citation) GEO - GSE87884
- (1 citation) GEO - GSE87882
- (1 citation) GEO - GSE87883
Similar Articles
To arrive at the top five similar articles we use a word-weighted algorithm to compare words from the Title and Abstract of each citation.
The transcription factor Zeb2 regulates development of conventional and plasmacytoid DCs by repressing Id2.
J Exp Med, 213(6):897-911, 16 May 2016
Cited by: 74 articles | PMID: 27185854 | PMCID: PMC4886362
Differential usage of transcriptional repressor Zeb2 enhancers distinguishes adult and embryonic hematopoiesis.
Immunity, 54(7):1417-1432.e7, 17 May 2021
Cited by: 13 articles | PMID: 34004142 | PMCID: PMC8282756
Ablation of cDC2 development by triple mutations within the Zeb2 enhancer.
Nature, 607(7917):142-148, 22 Jun 2022
Cited by: 26 articles | PMID: 35732734 | PMCID: PMC10358283
Models of dendritic cell development correlate ontogeny with function.
Adv Immunol, 143:99-119, 16 Sep 2019
Cited by: 10 articles | PMID: 31607369 | PMCID: PMC10931540
Review Free full text in Europe PMC
Funding
Funders who supported this work.
American Heart Association (1)
Grant ID: 12PRE12050419
Burroughs Wellcome Fund (1)
Grant ID: Career Award for Medical Scientists
HHS | National Institutes of Health (2)
Grant ID: 1K08AI106953
Grant ID: 1F31CA189491-01
Howard Hughes Medical Institute (1)
Grant ID: N/A
NCATS NIH HHS (1)
Grant ID: UL1 TR000448
NCI NIH HHS (2)
Grant ID: P30 CA091842
Grant ID: F31 CA189491
NIAID NIH HHS (1)
Grant ID: K08 AI106953


