Abstract
Free full text

Reliable neuromodulation from circuits with variable underlying structure
Abstract
Recent work argues that similar network performance can result from highly variable sets of network parameters, raising the question of whether neuromodulation can be reliable across individuals with networks with different sets of synaptic strengths and intrinsic membrane conductances. To address this question, we used the dynamic clamp to construct 2-cell reciprocally inhibitory networks from gastric mill (GM) neurons of the crab stomatogastric ganglion. When the strength of the artificial inhibitory synapses (gsyn) and the conductance of an artificial Ih (gh) were varied with the dynamic clamp, a variety of network behaviors resulted, including regions of stable alternating bursting. Maps of network output as a function of gsyn and gh were constructed in normal saline and again in the presence of serotonin or oxotremorine. Both serotonin and oxotremorine depolarize and excite isolated individual GM neurons, but by different cellular mechanisms. Serotonin and oxotremorine each increased the size of the parameter regions that supported alternating bursting, and, on average, increased burst frequency. Nonetheless, in both cases some parameter sets within the sample space deviated from the mean population response and decreased in frequency. These data provide insight into why pharmacological treatments that work in most individuals can generate anomalous actions in a few individuals, and they have implications for understanding the evolution of nervous systems.
How different are the brains in a population of healthy individuals of the same species? Both modeling and experimental studies demonstrate that similar circuit function can result from a large variation in the synaptic and intrinsic conductances that contribute to circuit function (1–11). This finding suggests that each individual could, during development, build a brain that differs significantly from all others and poses the question of whether circuits with diverse underlying structure, yet similar behavior, can respond reliably (12, 13) to neuromodulatory substances that alter brain states (14–21). Therefore, we used the dynamic clamp (22, 23) to construct 2-cell circuits (24) from neurons of the crab stomatogastric ganglion (STG). The strength of the reciprocal inhibitory synapses (gsyn) and the conductance of an artificial Ih (gh) were varied (24), and the resulting activity patterns were recorded in control saline and in response to 2 neuromodulatory substances, serotonin and the muscarinic agonist, oxotremorine.
In these hybrid experiments, the intrinsic properties of these 2 biological neurons vary between each other and across preparations while 2 of the important parameters for network performance are under experimental control. This method ensures that the variability intrinsic to biological systems is retained, while allowing access to some of the parameters controlling network performance.
Results and Discussion
We used gastric mill (GM) neurons of the STG of the crab, Cancer borealis. GM neurons were isolated from all known neuromodulatory and synaptic inputs (24) and were silent under control conditions. The dynamic clamp was used to establish reciprocal inhibitory synaptic conductances (gsyn) between 2 GM neurons and to add an artificial hyperpolarization-activated inward conductance (gh) to each neuron (Fig. 1A). Depending on the strength of the inhibitory synapses, and the amount of gh, these 2-celled circuits displayed a variety of circuit outputs (Fig. 1 B and C). In each experiment, gsyn and gh were varied over a large range (typically from 10 to 100 or 115 nS) in steps, thus generating a map containing 49–64 different combinations of synaptic and intrinsic parameters (Fig. 1B). The map in Fig. 1B is color-coded to illustrate the circuit behaviors: green indicates circuits in which 1 neuron was active and the other silent, blue indicates circuits in which both neurons were active but firing asynchronously, red indicates map points showing stable half-center oscillator behavior (24, 25) (alternating bursts of activity), and black shows map points at which both neurons were silent. Fig. 1C shows recordings from the circuits at the indicated map points.
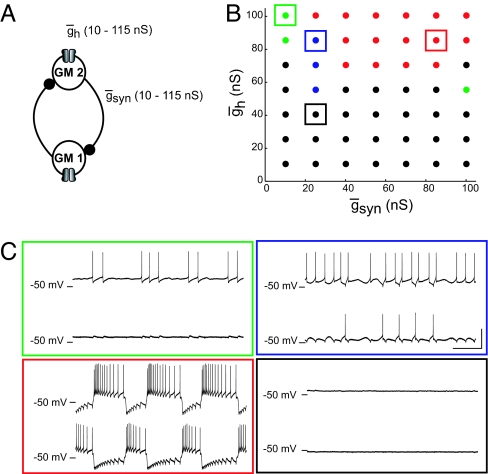
Circuit output depends on both synaptic and intrinsic conductances. (A) Schematic shows circuit constructed from 2 GM neurons with the dynamic clamp. The dynamic clamp creates a symmetrical reciprocally inhibitory synaptic conductance (gsyn) and an artificial intrinsic membrane conductance (gh). These maximal conductances were varied between 10 and 115 nS. (B) Map of gsyn–gh parameter space for coupled GM neuronal circuits. Black, green, blue, and red describe the circuit behavior as silent, asymmetrical, spiking, and bursting, respectively. (C) Intracellular recordings show voltage traces of representative circuit activity patterns. Colors are as in B; boxed points in B correspond to the parameter values of the traces in C. (Vertical scale bar: 20 mV; horizontal scale bar: 5 s.)
Both serotonin and oxotremorine act directly on isolated GM neurons. Serotonin is known to modulate a number of different ionic currents in STG neurons, including Ih, Ca2+ currents, and K+ currents (26–30). When applied to isolated GM neurons (n = 46), 10−6 M serotonin had a small, but statistically significant, effect on resting input impedance (control 22.3 ± 8.2 MΩ versus 25.3 ± 9.6 MΩ in serotonin, P < 0.003) and a small, but statistically significant, change in resting potential (control −62.3 ± 5.8 mV versus −59.9 ± 5.0 mV in serotonin, P < 0.001). The most dramatic effect of serotonin on the intrinsic properties of the GM neurons was a hyperpolarizing shift in the spike threshold in response to depolarizing ramps of current (control −42.4 mV ± 5.3 mV versus −51.0 mV ± 8.1 mV, P < 0.001). The consequences of these changes in intrinsic properties are seen in the response of GM neurons to injected current. Fig. 2A shows the response to the same depolarizing current pulse in control saline and serotonin. Fig. 2B shows a full FI (frequency/current) curve for the same neuron shown in Fig. 2A. Fig. 2C shows an average FI curve taken from fits to the FI curves of 22 neurons in control and serotonin. Note that the 2 curves are parallel, with the threshold for firing lower in serotonin.
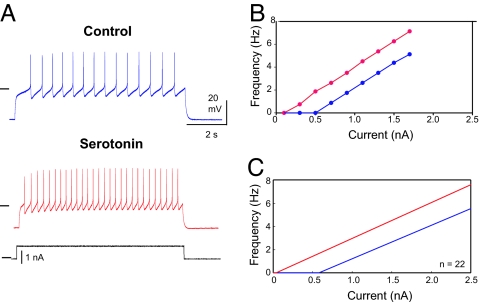
Serotonin excites GM neurons. (A) Voltage recordings from a GM neuron, which was given the same current pulse (black) in control (blue) and serotonin (red). Horizontal lines: − 40 mV; 0 nA. (B) Frequency/current (FI) plot from neuron in A. (C) Mean FI curves calculated by fitting a line to each individual cell's (n = 22) FI curve, and then obtaining a mean slope and a mean y-intercept to create an “average” FI curve.
After the construction of a control map, 10−6 M serotonin was applied to each preparation, and then a second map was made, allowing the examination of the effects of serotonin on 49–64 different circuits within each experiment. Fig. 3 shows the effects of serotonin on a typical preparation. In Fig. 3A, the maps are shown in 3 dimensions with the frequency of the half-center oscillatory rhythms (red dots) on the z axis. In control saline, the half-center frequencies were low. In the presence of serotonin, the half-center region expanded, and the frequency of many of the half-centers increased. Alternating single spikes were considered half-center activity [consistent with the tradition in experimental studies of locomotion (31, 32)], and many of the high-frequency points in Fig. 3A and the remaining figures consist of alternating single spikes.
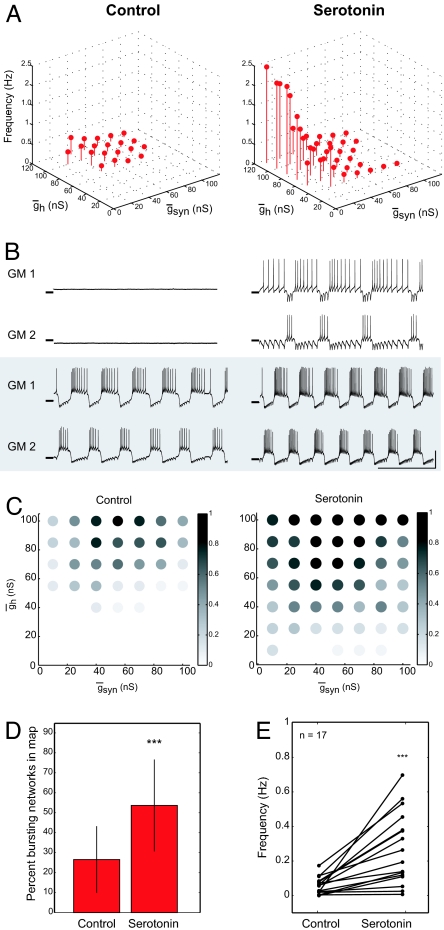
Serotonin expands the parameter sets that produce alternating bursts of activity and increases network frequency. (A) (Left) Control saline. 3D plot showing half-center frequency as a function of gsyn and gh in circuits with half-center activity. (Right) In 10−6 M serotonin. (B) Sample traces in control and serotonin. (Upper) gsyn = 55 nS and gh = 40 nS. (Lower) gsyn = 70 nS and gh = 115 nS. Horizontal line on traces indicates −50 mV. (Vertical scale bar: 20 mV; horizontal scale bar: 10 s.) (C) (Left) Distribution of bursting circuits in control. Grayscale shows the fraction of half-centers at each gsyn–gh parameter set (n = 17). (Right) Serotonin (10−6 M) increased the fraction of bursting circuits at many gsyn–gh map locations and expanded the range of parameters that produced bursting activity within the sampled parameter space. (D) Serotonin (10−6 M) increased the percentage of the map that contain bursting half-center circuits in each of 17 experiments (paired t test: P < 0.001). (E) Serotonin (10−6 M) increased the average frequency of the bursting half-center oscillator circuits in each experiment (paired t test: P < 0.001).
Fig. 3B shows recordings from 2 of the map points, at the parameters indicated in the figure caption. The top example (Fig. 3B) shows a circuit that was silent in control saline and became an oscillator in serotonin. The bottom traces of Fig. 3B show a circuit that was bursting in control saline and increased its burst frequency in serotonin. In general, the spike frequency and number of spikes in the burst also changed in serotonin. Fig. 3 C–E summarizes data pooled from 17 experiments. Fig. 3C shows that some parameter regions were more likely to produce half-center activity across all of the preparations. Fig. 3D demonstrates that more circuits produced stable alternating half-center activity in the presence of serotonin than in control saline. Fig. 3E shows the mean change in burst frequency of all of the rhythmic half-centers in all 17 experiments. These data demonstrate that, on average, serotonin significantly increased the burst frequency of the half-center oscillators (P < 0.001). The amount of this increase varied considerably across preparations, although the population effect was robust.
Despite the fact that the effects of serotonin on the pooled data are quite consistent, an examination of all of the individual half-center oscillator circuits shows that not all half-centers increased their frequency in serotonin. A few circuits responded anomalously, with a decrease in burst frequency (Fig. 4A). Fig. 4B shows the frequency in serotonin as a function of control frequency for 868 networks taken from 17 preparations. Most of the points are above the dashed identity line, but some are found below the identity line. There was a large range in the burst frequency increase seen in serotonin, and some parameter combinations showed large frequency increases. In Fig. 4B, asterisks are used to show those networks with alternating spikes and circles indicate alternating bursts. We then asked whether the anomalous behavior in serotonin was at similar parameter map positions across experiments. In 5 experiments, no anomalous points were seen, in 5 experiments 1 map point responded anomalously, and in 7 experiments 2 or more map points responded anomalously. Fig. 4C shows that there were no preferential positions (absolute or relative) of the map points that responded anomalously to serotonin. However, alternating single spike bursters showed characteristic map locations.
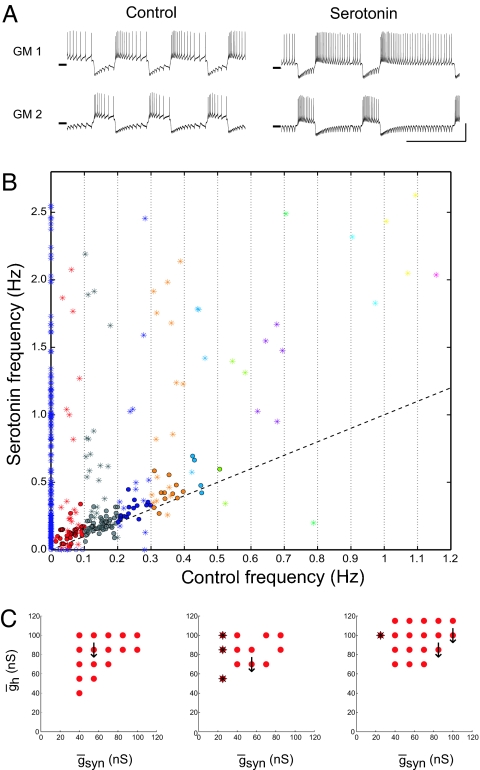
Mean serotonin-mediated increase in burst frequency masks serotonin's frequency reduction of a small number of circuits. (A) Example traces of a circuit that slowed in serotonin (gsyn = 85 nS and gh = 85 nS). Horizontal line on traces indicates −50 mV. (Vertical scale bar: 20 mV; horizontal scale bar: 20 mV). (B) Circuit frequency in 10−6 M serotonin as a function of control frequency. Asterisks indicate networks with single-spike bursts in either control or serotonin conditions. Dashed line indicates x = y. (C) Location of gsyn–gh parameter values of circuits that slowed (downward arrows) in 10−6 M serotonin in 3 experiments. Asterisks indicate networks with single spike bursters as seen in B.
To determine whether a different neuromodulator would produce effects similar to those of serotonin, we repeated these experiments with oxotremorine (Fig. 5). In STG neurons, oxotremorine activates a distinct current from the ones activated by serotonin. Specifically, oxotremorine activates the same modulator-activated, voltage-dependent inward current (IMI, formerly called the “proctolin current” or Iproct) as do many neuropeptides (33–35). Because of its voltage dependence, this current is largely off when the neuron is hyperpolarized, but it increases excitability as the neuron depolarizes. When applied to isolated GM neurons (n = 19), oxotremorine had no effect on resting input impedance (control, 28.0 ± 12.3 MΩ versus 27.1 ± 7.6 M Ω in oxotremorine, P = 0.73). Like serotonin, oxotremorine produced a small, but significant, depolarization of the resting potential (control, − 59.5 ± 4.7 mV versus −56.0 ± 4.3 mV in oxotremorine, P ~ 0.001), but only a modest hyperpolarizing shift in the spike threshold (control −38.8 mV ± 4.4 mV versus −41.6 ± 3.8 mV in oxotremorine, P = 0.0351). Fig. 5 A–C shows the effects of oxotremorine on the FI curve of GM neurons. Like serotonin, oxotremorine increases the response to a single pulse of depolarizing current. Nonetheless, the FI curves show a marked difference in slope, with little or no change in the x intercept. Taken together, these data show that while both serotonin and oxotremorine enhance the excitability of GM neurons, they have characteristic and different effects on the FI curves of the neurons.
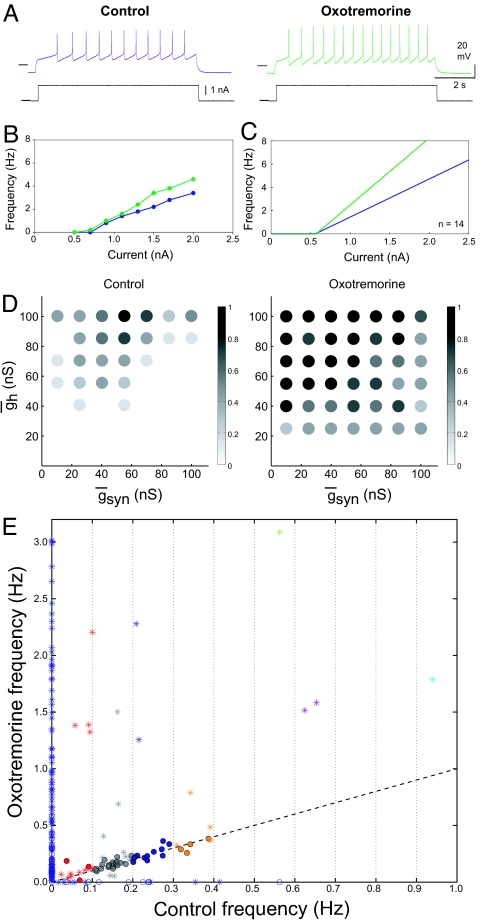
Oxotremorine excites isolated GM neurons and increases the number of single-spike bursters in reciprocally inhibitory networks. (A) Voltage recordings from a GM neuron in control (blue) and oxotremorine (green). Horizontal lines on traces indicate −40 mV. Current traces are shown in black; horizontal line indicates 0 nA. (B) FI plot from preparation shown in A. (C) Mean FI curve calculated as described in Fig. 2C (n = 14). (D) Distribution of bursting circuits in control (Left) and oxotremorine (Right). Grayscale corresponds to the fraction of half-center networks at each gsyn–gh parameter set across 8 preparations. Oxotremorine (10−5 M) increased the fraction of bursting circuits at many map locations and expanded the range of gsyn and gh values that produced half-centers. (E) Circuit frequency in 10−5 M oxotremorine as a function of circuit frequency in control saline. Asterisks indicate single-spike bursting networks as seen in Fig. 4B. Dashed line indicates x = y.
Oxotremorine produced map expansion (n = 8) and increased the percentage of bursting networks from 21.6 ± 14.6 in control to 57.2 ± 29.5 in oxotremorine (P = 0.019) (Fig. 5D). The mean burst frequency went from 0.05 ± 0.004 Hz in control to 0.34 ± 0.03 Hz in oxotremorine (P = 0.04). Fig. 5E shows an overview of the effects of oxotremorine on all of the networks. Again, considerably more points are above the line or on the line than below the line. Thus, although serotonin and oxotremorine shift the FI curves of isolated GM neurons differently, the overall conclusions taken from them are quite similar.
These dynamic clamp experiments have the precision and transparency of a modeling study, in that we were able to generate circuits in which the synaptic strength and Ih conductances are known and reproducible across preparations. The biological neurons, however, retain the variability and noise inherent in biological systems. Therefore, it is not surprising that the position and size of the half-center maps vary across experiments. Nonetheless, despite the variability of the individual neurons, and the underlying variations in circuit parameters, the effects of both serotonin and oxotremorine were consistent. Indeed, the population effects reported here in response to these substances are as robust as is usually found in the responses of neuronal preparations to neuromodulators (14–21, 36).
These data demonstrate that the responses to a neuromodulator (or by extension, other perturbations) can be statistically reproducible and reliable across circuits producing similar behavior even when their underlying parameters are quite disparate. This result is contrary to the intuitions of some (12), despite the fact that common sense tells us that it is extremely unlikely that all human brains could have identical circuit architectures that are also tuned identically. The present study also demonstrates that some specific sets of circuit parameters give rise to circuits that respond anomalously to a neuromodulator. Interestingly, there is no obvious logic to where on the parameter maps these anomalous parameter sets are found, indicating that even circuits formed from 2 neurons, with all of the noise characteristic of biological neurons, have sufficiently complex dynamics to preclude simple predictions of their behavior across all parameter regimes.
The circuits found in populations of “normal” individuals must vary in underlying structure (1). All of these circuits may work adequately and appropriately under most conditions, and most, but not all, may respond consistently to changes in neuromodulatory environment. Nonetheless, some individuals will respond anomalously to drugs (37), food, or sensory stimuli, even when their baseline behavior may be within the normal range. Untoward responses to pharmacological agents may occur when individuals contain circuits whose underlying parameters combine to make them particularly susceptible to certain kinds of perturbations, although each of the underlying parameters could be within normal ranges.
The conclusions presented here are similar to those emerging from studies of intracellular signaling networks (38, 39). Widely disparate solutions that produce similar circuit behaviors may be evolutionarily advantageous, or even necessary for evolution (38–40). Because multiple solutions are possible during evolution, genetic change could accumulate without obvious phenotypic change. The effects of these accumulated changes might be revealed only after a novel perturbation or after an additional genetic alteration occurs. A population of individuals, all of whom have circuits that are “good enough” to allow each individual to function under usual environmental conditions, but who differ among themselves in their underlying structure, is more likely to contain certain individuals who are well-suited to respond adaptively to a novel stimulus than a uniform population. Maintaining in the population individuals with anomalous responses to an environmental or internal perturbation may be necessary to ensure sufficient diversity to provide the population with the capacity to cope with a variety of perturbations, even if not all individuals respond the same way.
Materials and Methods
Crabs (C. borealis; n = 38) were purchased from Yankee Lobster and kept in artificial sea water until used. Animals were chilled for 30 min on ice, and then the STG was dissected and pinned into a Sylgard-coated (Dow Corning) dish in 10–12 °C saline. Saline consisted of 440 mM NaCl, 11 mM KCl, 13 mM CaCl2, 26 mM MgCl2, 11.2 mM Trizma base, and 5 mM maleic acid, pH 7.47.
Electrophysiology.
The STG was desheathed and superfused with chilled 10–12 °C saline. Extracellular recordings were obtained by placing petroleum jelly wells on motor nerves and sticking a steel pin electrode in each well. Signals were amplified and filtered by using a differential AC amplifier (A-M Systems). Intracellular recordings were made with 15- to 25-MΩ glass microelectrodes filled with 0.6 M K2SO4 and 20 mM KCl. Signals were recorded with 2 Axoclamp 2B amplifiers (Axon Instruments). After GM motor neurons were identified by using intracellular and extracellular traces (41, 42), 10−5 M tetrototoxin (Sigma) was added to a well located on the desheathed STN to remove action potential-mediated input from neuromodulatory inputs. Picrotoxin (PTX; 10−5 M; Sigma) was superfused to block all inhibitory glutamatergic synapses (43). Forty minutes after PTX application, GM intrinsic membrane properties were measured.
RealTime Linux Dynamic Clamp (44) version 2.6 was run on an 800-MHz Dell Precision computer. Dynamic clamp experiments were done in discontinuous current clamp mode. Sampling rates were 1.5–2.0 kHz, and the timing of the second amplifier was slaved to the first. The artificial synaptic current (Isyn) was based on Sharp et al. (24), and the artificial Ih was after Buchholtz et al. (45). Detailed equations and parameters are in SI Text and Table S1. Data were acquired with a Digidata 1200 data acquisition board (Axon Instruments) using Clampex 9.0. Details of burst and spike detection are in SI Text.
Parameter Maps.
gsyn and gh were varied between 10 and 115nS in steps of 15 nS. The circuit behavior at each gsyn–gh parameter combination was recorded. To maximize the number of circuits tested in each experiment while ensuring that a stable sample of each circuit was taken, when neither or only 1 GM neuron spiked, a 30-s stretch of data were recorded, but 2 min were taken when both GM neurons were firing. The gsyn–gh parameter space was mapped in 10−5 M PTX and then in either 10−5 M PTX and 10−6 M serotonin (Sigma) or 10−5 M oxotremorine (Sigma). One experiment was excluded from this study because no parameter sets produced half-center oscillators in control or 10−5 M oxotremorine.
After analyzing the voltage traces, the system was categorized. Cells sometimes exhibited transient spiking when the gsyn–gh parameter combination was changed, so we required spikes to occur after the halfway point in each recording to categorize a cell as spiking. If neither cell was spiking, the system was classified as silent. If 1 cell was spiking and the other was not, the system was classified as asymmetric. If both cells were spiking, the system was classified as either spiking or half-center. To determine whether a circuit was half-center, we calculated a measurement of burst exclusion xnetwork, that ranged from −1 (simultaneous bursts) to +1 (alternating bursts). Detailed equations for xnetwork, are in SI Text. Circuits with 2 active cells were categorized as half-center if xnetwork ≥ 0.1, otherwise they were characterized as spiking.
In circuits classified as half-center, activity periods were defined as the duration from onset of activity in a cell, to the next onset of activity in the same cell. The half-center frequency was defined as the reciprocal of the mean activity period (averaged over both cells). In circuits not classified as half-center, the half-center frequency was defined to be 0.
Acknowledgments.
We thank Dr. Adam L. Taylor for technical and computational help. This work was supported by National Institutes of Health Grants MH-46472 (to E.M. and T.B.) and NS-058110 (to R.G.).
Footnotes
The authors declare no conflict of interest.
This article contains supporting information online at www.pnas.org/cgi/content/full/0905614106/DCSupplemental.
References
Articles from Proceedings of the National Academy of Sciences of the United States of America are provided here courtesy of National Academy of Sciences
Full text links
Read article at publisher's site: https://doi.org/10.1073/pnas.0905614106
Read article for free, from open access legal sources, via Unpaywall:
https://europepmc.org/articles/pmc2701344?pdf=render
Free after 6 months at www.pnas.org
http://www.pnas.org/cgi/content/abstract/106/28/11742
Free after 6 months at www.pnas.org
http://www.pnas.org/cgi/content/full/106/28/11742
Free after 6 months at www.pnas.org
http://www.pnas.org/cgi/reprint/106/28/11742.pdf
Citations & impact
Impact metrics
Citations of article over time
Alternative metrics
Smart citations by scite.ai
Explore citation contexts and check if this article has been
supported or disputed.
https://scite.ai/reports/10.1073/pnas.0905614106
Article citations
Dimensionality reduction of neuronal degeneracy reveals two interfering physiological mechanisms.
PNAS Nexus, 3(10):pgae415, 19 Sep 2024
Cited by: 1 article | PMID: 39359396 | PMCID: PMC11443964
Serotonergic modulation of vigilance states in zebrafish and mice.
Nat Commun, 15(1):2596, 22 Mar 2024
Cited by: 0 articles | PMID: 38519480 | PMCID: PMC10959952
Dynamics of antiphase bursting modulated by the inhibitory synaptic and hyperpolarization-activated cation currents.
Front Comput Neurosci, 18:1303925, 09 Feb 2024
Cited by: 0 articles | PMID: 38404510 | PMCID: PMC10884300
Reciprocally inhibitory circuits operating with distinct mechanisms are differently robust to perturbation and modulation.
Elife, 11:e74363, 01 Feb 2022
Cited by: 5 articles | PMID: 35103594 | PMCID: PMC8884723
Neuromodulation and Individuality.
Front Behav Neurosci, 15:777873, 24 Nov 2021
Cited by: 9 articles | PMID: 34899204 | PMCID: PMC8651612
Review Free full text in Europe PMC
Go to all (54) article citations
Data
Data behind the article
This data has been text mined from the article, or deposited into data resources.
BioStudies: supplemental material and supporting data
Similar Articles
To arrive at the top five similar articles we use a word-weighted algorithm to compare words from the Title and Abstract of each citation.
Mechanisms of oscillation in dynamic clamp constructed two-cell half-center circuits.
J Neurophysiol, 76(2):867-883, 01 Aug 1996
Cited by: 73 articles | PMID: 8871205
Perturbation-specific responses by two neural circuits generating similar activity patterns.
Curr Biol, 31(21):4831-4838.e4, 09 Sep 2021
Cited by: 7 articles | PMID: 34506730 | PMCID: PMC8578407
The roles of co-transmission in neural network modulation.
Trends Neurosci, 24(3):146-154, 01 Mar 2001
Cited by: 223 articles | PMID: 11182454
Review
Graded Transmission without Action Potentials Sustains Rhythmic Activity in Some But Not All Modulators That Activate the Same Current.
J Neurosci, 38(42):8976-8988, 05 Sep 2018
Cited by: 6 articles | PMID: 30185461 | PMCID: PMC6191523
Funding
Funders who supported this work.
NIMH NIH HHS (2)
Grant ID: R01 MH046742
Grant ID: MH-46472
NINDS NIH HHS (2)
Grant ID: NS-058110
Grant ID: F31 NS058110


