Abstract
Free full text

Prediction of histone post-translational modification patterns based on nascent transcription data
Abstract
The role of histone modifications in transcription remains incompletely understood. Here we examine the relationship between histone modifications and transcription using experimental perturbations combined with sensitive machine-learning tools. Transcription predicted the variation in active histone marks and complex chromatin states, like bivalent promoters, down to single-nucleosome resolution and at an accuracy that rivaled the correspondence between independent ChIP-seq experiments. Blocking transcription rapidly removed two punctate marks, H3K4me3 and H3K27ac, from chromatin indicating that transcription is required for active histone modifications. Transcription was also required for maintenance of H3K27me3 consistent with a role for RNA in recruiting PRC2. A subset of DNase-I hypersensitive sites were refractory to prediction, precluding models where transcription initiates pervasively at any open chromatin. Our results, in combination with past literature, support a model in which active histone modifications serve a supportive, rather than an essential regulatory, role in transcription.
Introduction
The discovery that core histones are post-transcriptionally modified fueled nearly six decades of speculation about the role that histone modifications play in transcriptional regulation by RNA polymerase II (Pol II)1. Many of the best-studied histone modifications are deeply conserved within eukaryotes, indicating important functional roles2–4. Indeed, numerous examples illustrate how the disruption of histone modifications, or their associated writer and eraser enzymes, lead to defects in transcription and cellular phenotypes5–8. Histone modifications are found in highly stereotyped patterns across functional elements, including promoters, enhancers, and over the body of transcribed genes and non-coding RNAs9,10. The stereotyped pattern of histone modifications makes them useful in the annotation of functional elements in eukaryotic genomes, providing insight into phenotype-associated genetic variation11,12 and molecular changes associated with disease13.
Despite their apparent correlation with active transcription, whether histone modifications have a direct role in transcriptional regulation or an indirect role as “cogs” in the transcription machinery, remains debated14,15. Certain combinations of histone modifications, most notably the bivalent chromatin signature consisting of H3K4me3 and H3K27me3, are speculated to mark specific genes for transcriptional activation in later developmental stages16. In another example, the balance between H3K4me1 and H3K4me3, which has long been known to correlate with enhancer and promoter activity17, has been proposed to establish these two regulatory roles18. Another question that remains heavily debated is the extent to which distinct histone modifications mark DNA sequence elements that otherwise have similar functional activities. H3K27ac, H3K64ac, and H3K122ac are all reported to denote distinct sets of enhancers19. Finally, to what extent do histone modifications cause transcription? The nature of the quantitative relationship between transcription and histone modification lies at the crux of this open question. Under one model, histone marks have a direct role in specifying cell-type transcriptional regulatory states of genes. Alternatively, if histone modifications serve as “cogs” that have a critical role in transcription, but do not themselves have a regulatory role independent of transcription factors, we might expect that they are completely correlated with on-going transcription.
Here we trained sensitive machine-learning models that decompose maps of primary transcription into ChIP-seq profiles representing nine distinct histone modifications. We show that transcription measured using precision run-on and sequencing (PRO-seq)20–22 can recover the patterns of active histone modifications at nucleosome resolution and with an accuracy that rivals the correlation between independent ChIP-seq experiments in holdout cell types. Furthermore, the correct pattern of two histone modifications, H3K4me3 and H3K27ac, was dependent on continued transcription by Pol II. These results support models in which histone modifications associated with active chromatin are “cogs” with a supportive role, rather than a direct regulatory role, in transcription.
Results
Imputation of histone marks using nascent transcription
To better understand the nature of the relationship between transcription and histone modifications, we trained an algorithm called discriminative histone imputation using transcription (dHIT). dHIT uses the distribution of RNA polymerase, measured using any of the related run-on and sequencing methodologies – PRO-seq, GRO-seq, or ChRO-seq (henceforth referred to simply as PRO-seq) – to impute the level of histone modifications genome-wide. Run-on assays provide a readout of the position and density of RNA polymerase, which dHIT passes to a support vector regression (SVR) trained to impute, or “guess”, the genome-wide distribution of chromatin structure and marks. During a training phase, the SVR optimized a function that mapped PRO-seq signal to the quantity of ChIP-seq signal at each position of the genome (Fig. 1a; see Methods). Once a dHIT model was trained using existing ChIP-seq data, it can impute steady state histone modifications in any cell type, provided that the relationship between histone modification and transcription is preserved. We trained dHIT to impute the levels of 10 different histone modifications that are widely deployed to analyze chromatin state (Fig. 1a)10,23–25. To avoid overfitting to batch-specific features in a single run-on and sequencing dataset25, training was performed using seven datasets in K562 cells that exemplify the range of variation commonly observed between data in library quality, sequencing depth, run-on strategy (PRO-seq or GRO-seq), and pausing index (Supplementary Tables 1 and 3).
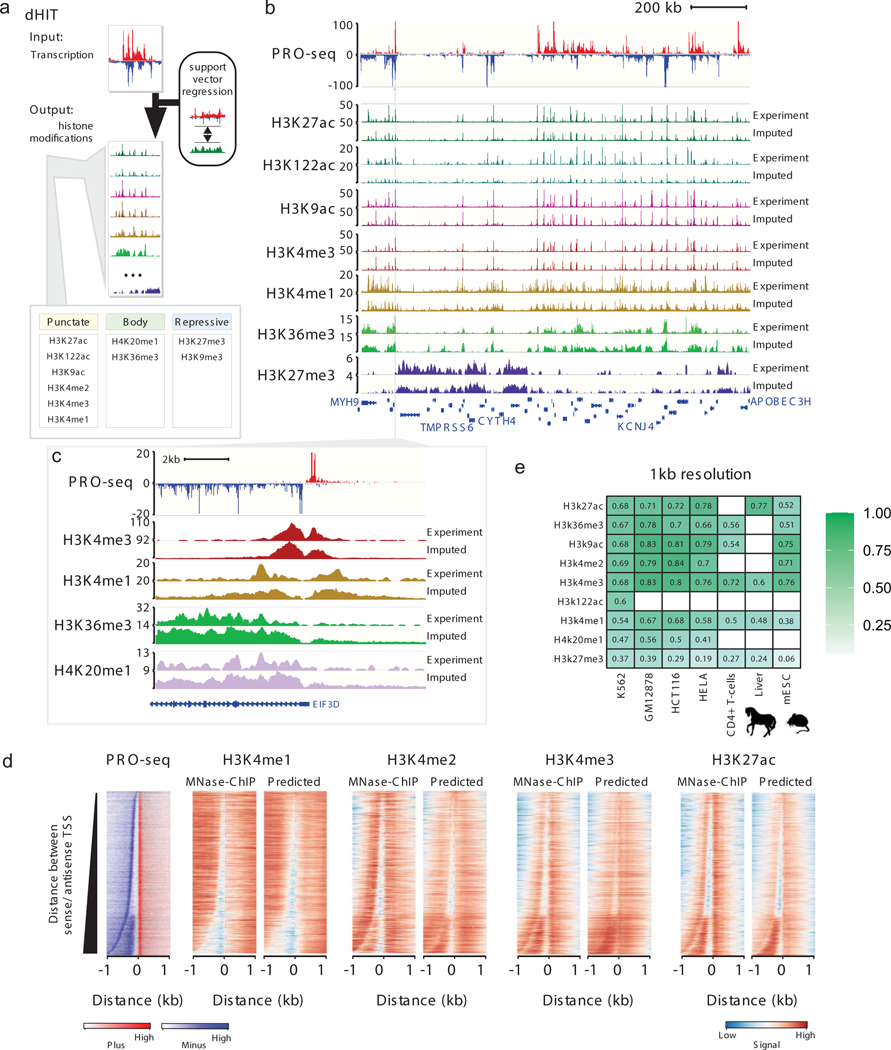
(a) Schematic of the dHIT algorithm. PRO-seq and ChIP-seq data in K562 cells were used to train a support vector regression (SVR) classifier to impute 10 different histone modifications.
(b) Genome browser comparison between experimental and predicted histone modifications on a holdout chromosome (chr22). PRO-seq data used to generate each imputation are shown on top.
(c) Genome browser comparison between experimental and predicted histone marks near the promoter of EIF3D. PRO-seq data used to generate each imputation are shown on top.
(d) Heatmaps show the distribution of transcription (left) and histone modifications (right) measured using MNase ChIP-seq or predicted using transcription. Rows represent transcription initiation domains in K562 cells. Heatmaps were ordered by the distance between the most frequently used TSS in each transcription initiation domain on the plus and minus strands.
(e) Pearson's correlation between predicted and expected values for nine histone modifications. Values are computed on the holdout chromosome (chr22) in humans, chr1 in horses, and chr1 in mice. Empty cells indicate that no experimental data are available for comparison in the cell type shown.
We evaluated the accuracy of each dHIT imputation model on a holdout chromosome in one of the training datasets (chr22; Fig. 1b–c; Extended Data Figs. 1 and and2).2). Histone modification signal intensity imputed using dHIT was highly correlated with experimental data for a variety of marks with different genomic distributions. The most notable differences between imputed and experimental signals tended to be small differences in background regions with low intensity in both experimental and imputed signal, but which added up over large windows, reflecting technical sources of variation in ChIP-seq background signal that were not reflected in PRO-seq signal (Extended Data Fig. 1; Supplementary Note 1). We did not observe major differences in accuracy at different types of functional elements, including regions of high signal intensity in either experimental or imputed data, near gene promoters26,27, at distal enhancer elements, and at stable and unstable transcription start sites (TSS)11 (Extended Data Fig. 2). In addition to well-studied and commonly used histone marks, we also obtained a high degree of correspondence for less widely studied histone modifications such as histone H3 lysine 122 acetylation (H3K122ac). Nevertheless, dHIT models trained to impute H3K122ac had a high correlation on the holdout chromosome (Fig. 1b). Of the marks for which we attempted to train models, only the repressive mark H3K9me3 did not perform well against either ENCODE data, or against higher-quality CUT&RUN data28 (Extended Data Fig. 2m).
In many cases, imputation captured the fine-scale distribution of histone mark signals near the TSS of annotated genes or enhancers (Fig. 1c; Extended Data Fig. 2c–l; Extended Data Fig 2n). To explore the limit of the resolution for histone mark imputation using transcription, we obtained new ChIP-seq data for four active marks whose distribution correlates with enhancers and promoters (H3K4me1, H3K4me2, H3K4me3, and H3K27ac) at nucleosome resolution by using MNase to fragment DNA. We trained new SVR models in K562 cells that take advantage of the higher-resolution MNase ChIP-seq data, excluding chromosome 22 as a holdout to confirm a high correlation (Extended Data Fig. 3a–b). Examination of genome-browser traces near the TSS of genes on the holdout chromosome confirmed that dHIT could impute active marks with high resolution (Extended Data Fig. 3c).
Genome-wide, several aspects of chromatin organization were correlated with the precise location of TSSs and Pol II pause sites. These features are readily apparent when sorting by the distance between the strongest TSS on the plus and minus strand29–31 (Fig. 1d). First, when the distance between the maximal sense and divergent TSS was larger than ~300 bp, we observed a nucleosome between the divergent start sites that was marked predominantly with H3K4me3 and H3K27ac but depleted for H3K4me1. Second, H3K4me3 and H3K27ac signals were highest on the +1 nucleosome, as well as the nucleosome found inside of the initiation domain. Third, H3K4me2 was highest on the −1 nucleosome. Fourth, the gene body mark, H3K36me3, was depleted at the promoter, and enriched in the body of transcribed genes (Extended Data Fig. 3d). Each of these correlations between TSSs and chromatin marks were also observed to varying degrees in genome-wide imputation in K562 cells (Fig. 1d), in imputation data in a complete holdout cell type, GM12878 (Extended Data Fig. 3e). Thus, dHIT recovered the placement of nucleosomes constrained to ordered arrays whose position correlated with transcription initiation.
Imputation accuracy across cell types and species
We asked whether the relationship between transcription and histone modifications is a general feature shared across mammalian cell types. We computed the correlation between imputed and experimental histone marks in five holdout datasets without retraining the model. Active marks were recovered with a similar fidelity in holdout cell types as observed for K562 (Pearson’s R = 0.38–0.84 [median R = 0.73]; Fig 1e, Extended Data Fig. 4a–c), substantially higher than duplicating values from the training dataset (Extended Data Fig. 4d). Lower correlations were generally observed when the experimental ChIP-seq data (certain CD4+ T-cell datasets) or the PRO-seq data (e.g., HeLa) had fewer sequenced reads or lower values in other data quality metrics (Supplementary Table 3). Cell-type-specific signal differences were predicted with reasonably high accuracy (Pearson’s R = 0.44–0.70 for active marks; Extended Data Fig. 4f), providing additional confidence that dHIT was not simply learning the average signal intensity of histone modification32. Thus, dHIT accurately recovered the distribution of active histone marks in a way that generalized to all new cell types examined here.
To more intuitively interpret the accuracy of dHIT, we compared correlations between imputed and ChIP-seq data to those observed between different experimental datasets in K562 and GM12878. For active marks, and for H3K27me3, correlations between dHIT imputation and experimental data were often within the range observed between experimental datasets (Extended Data Fig. 5). In addition to signal intensity, imputation could also recover the location of ENCODE peak calls in GM12878 with an accuracy rivaling ChIP-seq experiments (Extended Data Fig. 2m). These data indicate that imputation achieved performance similar to ChIP-seq experimental replication for most marks.
We examined specific loci in which imputed histone marks differed substantially from experimental data. Differences could reflect either cases in which histone modifications deviate from transcription for a specific mechanistic reason, or biological differences between cell stocks, growth conditions, handling, or other confounding factors. To distinguish between these possibilities, we repeated ChIP-seq for H3K27ac in K562 cells that were closely matched with those used to prepare PRO-seq libraries. In nearly all cases, our own ChIP-seq data resolved major discrepancies between imputed and ENCODE datasets (Extended Data Fig. 6a–b). We therefore concluded that major discrepancies between imputed and experimental marks predominantly reflect intrinsic biological or technical differences, rather than divergence between transcription and histone modifications.
Two patterns of H3K27me3 reflect separate cellular states
We identified one important exception on the extent to which histone imputation generalized between cell types. The repressive mark H3K27me3 had a reasonable correlation with experimental data in K562, GM12878, and horse liver (median Pearson’s R = 0.31), consistent with the correlation expected from biological replication in K562. In these cell types, H3K27me3 was distributed across broad genomic intervals, which were identified with reasonable fidelity by dHIT imputation (Fig. 2a, top). However, we observed a much weaker correlation in mouse embryonic stem cells (mESCs, Pearson’s R = 0.06). Examination of signal tracks showed that the distribution of H3K27me3 differed dramatically from the K562 cell dataset. In mESCs, H3K27me3 was predominantly positioned in punctate peaks near weakly transcribed promoters (Fig. 2a, bottom). Although a handful of loci with critical developmental importance, notably all four Hox gene clusters, had a broad distribution in the mESC data, these did not show the pattern expected in the mark based on transcription (Extended Data Fig. 6c). Analysis of H3K27me3 in 86 high-quality samples showed that stem, germ, and certain progenitor cells usually had a punctate pattern, whereas most somatic cell types had the broadly distributed pattern (Extended Data Fig. 6d–f). Thus, although we cannot completely discount the possibility that technical factors contribute to this difference in H3K27me3 distribution33–35, both punctate and broad H3K27me3 distributions appear even when libraries were prepared by the same laboratory36 or consortium23,24. These observations suggest that H3K27me3 can occur in at least two distinct profiles, and that transcription is able to predict the broadly distributed profile found in somatic cell types with reasonable accuracy.
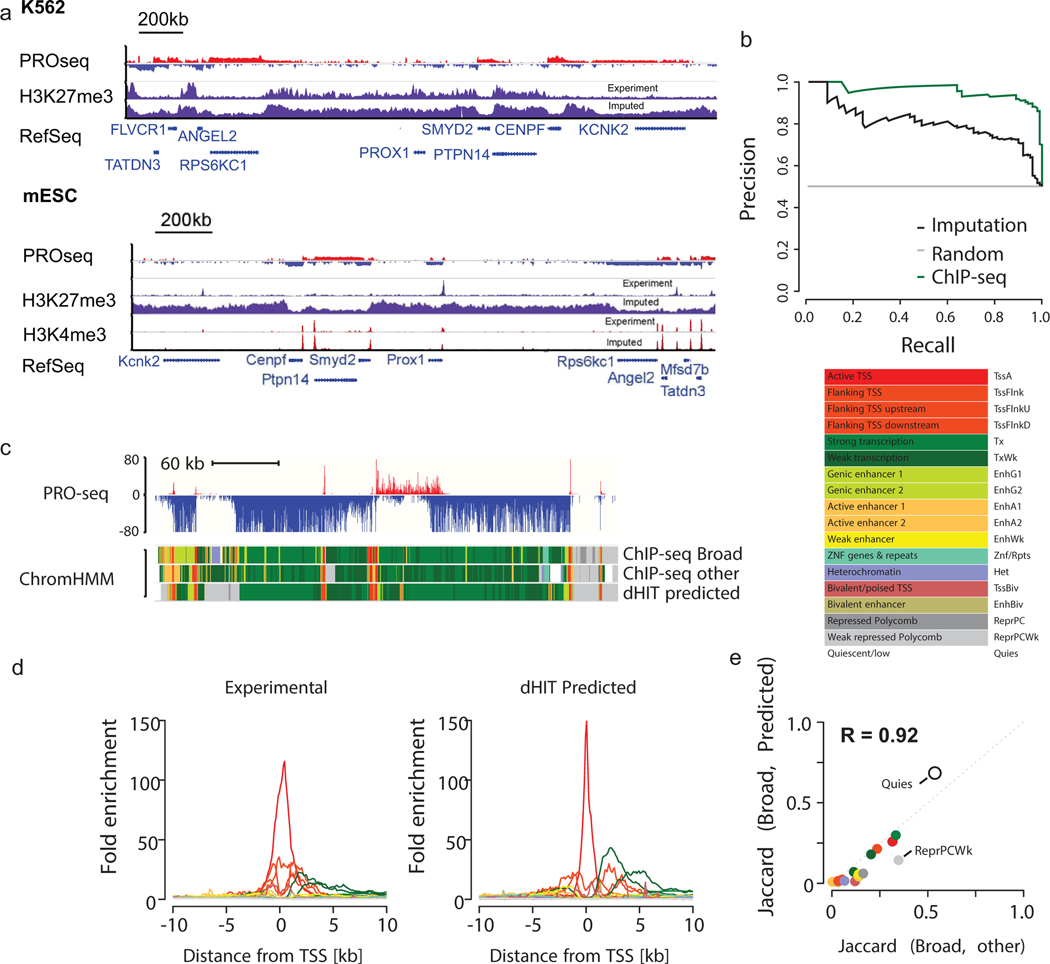
(a) Genome browser shows PRO-seq data and histone modification data measured by ChIP-seq or predicted using PRO-seq in the Prox1 locus. Prox1 is marked by bivalent H3K4me3 and H3K27me3 histone modifications in mESCs.
(b) Precision recall curve illustrates the accuracy of bivalent gene classification by a random forest classifier using ChIP-seq data (green) or dHIT imputation (black). The gray line denotes random classification. Classification was performed on a matched set of TSSs (50% bivalent, 50% not bivalent) that was held out during random forest training.
(c) Genome browser in K562 cells shows 18 state chromHMM model using either ChIP-seq data used to train the model (Broad), alternative ChIP-seq data in K562 (other), or based on imputation (dHIT predicted). PRO-seq data used during dHIT imputation are shown on top.
(d) Enrichment in each of 18 chromatin states as a function of distance from RefSeq annotated TSSs.
(e) Jaccard distance between chromHMM states inferred using ChIP-seq from Broad and predicted data (y-axis) and states inferred using ChIP-seq from Broad and an alternative compilation of high-quality ChIP-seq data (x-axis).
Imputation of bivalent promoters and other chromatin states
We next asked whether dHIT could impute complex chromatin states consisting of multiple histone marks. The bivalent chromatin state, best described in ESCs and germ cells, is a perfect example where nucleosomes near gene promoters are marked with both H3K4me3 and H3K27me3. We used dHIT models trained on ENCODE ChIP-seq data in K562 cells to impute H3K4me3 and H3K27me3 based on a GRO-seq dataset in mESCs37. Despite cell-type-specific differences in the relationship between transcription and H3K27me3 between K562 and mESCs, we observed a strong tendency for bivalent promoters in mESCs to fall inside broad domains predicted to have high H3K27me3. For example, the K562 model predicts that Prox1 resides inside of a broad H3K27me3 domain (Fig. 2a). Despite being far from highly transcribed genes, the Prox1 promoter is weakly transcribed, and the imputation correctly places a H3K4me3 peak. Nearly 80% of bivalent gene promoters could be separated from promoters associated with either mark alone, or neither mark, with a precision of 80%, using a random forest on holdout data (Fig. 2b). Notably, promoters that carry the H3K27me3 mark in mESCs were distinguished accurately from those carrying no mark, indicating that promoters carrying the H3K27me3 are generally not transcriptionally silent. Taken together, these results demonstrate that bivalent genes can be identified based on the distribution of active transcription alone.
To generalize our observations on bivalent genes to other chromatin states, we asked whether chromatin marks imputed using transcription can infer chromatin states defined by chromHMM38. We used a previously reported chromHMM model that defined 18 distinct chromatin states using ChIP-seq data from six marks for which we trained imputation models (H3K4me3, H3K27ac, H3K4me1, H3K36me3, H3K9me3, and H3K27me3)24,39. Examination on the genome browser revealed that chromatin states were highly similar, regardless of whether they were defined using ENCODE data or dHIT imputation (Fig. 2c–d, Extended Data Fig. 7a). To determine the concordance expected between chromatin states defined using independent collections of experimental data, we applied chromHMM to a distinct collection of ChIP-seq data in the same cell type (Supplementary Table 1). The Jaccard similarity index between imputed and experimental data were highly correlated with those observed between other ChIP-seq datasets (Pearson’s R = 0.92; Fig. 2e, Extended Data Fig. 7b–c). Taken together, these results suggest that transcription alone is sufficient to infer complex chromatin states, especially active chromatin states.
Genome annotation using a single functional assay
Histone modifications are widely used to annotate mammalian genomes. We hypothesized that since dHIT can accurately predict chromatin marks, it provides a strategy for genome annotation in limited samples or new mammalian species using a single molecular tool. We analyzed chromatin states in 20 primary glioblastomas (GBMs) for which we recently published ChRO-seq data22. ChromHMM analysis revealed both broad similarities and putative differences in chromatin states between different GBMs (Fig. 3a). Analysis of histone modifications using ChIP-seq of this same set of samples would require 120 experiments (Fig. 3b) and deeper sequencing to match ENCODE guidelines. Thus, ChRO-seq and dHIT can resolve intricate patterns of chromatin organization using a single molecular assay.
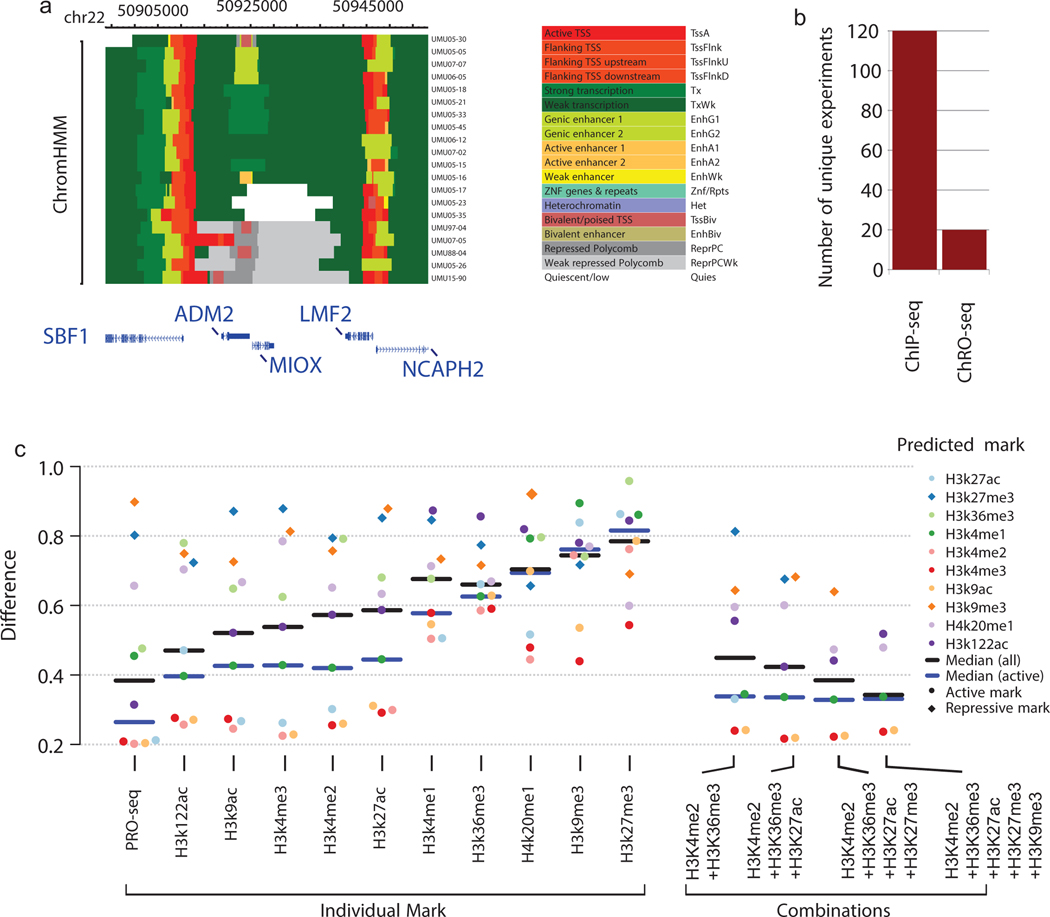
(a) ChromHMM states inferred using ChRO-seq data from 20 primary glioblastomas.
(b) The number of unique ChRO-seq or ChIP-seq libraries required to analyze chromatin states in 20 primary glioblastomas.
(c) The mean difference between predicted and experimental ChIP-seq data on a holdout chromosome (chr22) (y-axis). SVR models were trained using the indicated experimental mark (left) or the indicated combination of histone marks (right).
Another critical application is to efficiently annotate functional elements in diverse tissues from understudied species. We obtained ChRO-seq data from the liver of two horses that serve as the focus of the Functional Annotation of Animal Genomes (FAANG) project40–42. Using dHIT and models trained in K562 cells, we imputed patterns of H3K27ac, H3K4me3, H3K4me1, and H3K27me3 that were highly correlated with experimental data from the same tissues (Fig. 1e; Extended Data Fig. 7d). In addition to those histone marks measured by FAANG, dHIT also imputed patterns for five additional histone marks, providing new information about chromatin state that was not obtained by the FAANG consortium. Next, we prepared ChRO-seq libraries in eight murine tissues (Extended Data Fig. 7e; Extended Data Fig. 8a–b). After accounting for biological replication in this experiment43 (7 replicates × 8 tissues × 9 histone marks), it would have taken 504 ChIP-seq assays to prepare this same dataset. Thus, using dHIT to interpret ChRO-seq data provides individual laboratories access to consortium-scale functional annotation tools.
We then asked whether PRO-seq more accurately predicted unobserved histone modifications than SVR models trained using a small number of observed histone modifications. PRO-seq achieved a higher accuracy than any other individual chromatin mark or combination of chromatin marks (Fig. 3c, black; Supplementary Note 2). Thus, we conclude that PRO-seq improved the accuracy of histone mark imputation by encoding signals from multiple functional regions and by improving spatial resolution compared with ChIP-seq data.
Promoter histone modifications depend on transcription
The strong correlation observed between Pol II and histone modifications implies a causal relationship between the histone marks and transcription. However, correlations do not provide insight into which direction causality might run. To assess whether Pol II activity is necessary for the establishment of histone modification patterns, we rapidly blocked transcription initiation using the small molecule Trp and observed the immediate effects on both transcription (using PRO-seq) and histone modifications (using MNase-ChIP-seq) (Fig. 4a)44,45. After spike-in normalization, PRO-seq revealed the expected pattern of changes in Pol II throughout the time-course37 (Fig. 4c; Extended Data Fig. 8; Supplementary Note 3). We performed MNase-ChIP-seq for four active histone marks: H3K4me1, H3K4me3, H3K27ac, H3K36me3, and one repressive mark: H3K27me3. To normalize libraries for systematic variation in MNase cutting and immunoprecipitation efficiency, we added Dryas iulia butterfly cells to each immunoprecipitation as a spike-in control, resulting in experiments that were highly correlated with public data (Extended Data Fig. 8g–i, ,jj).
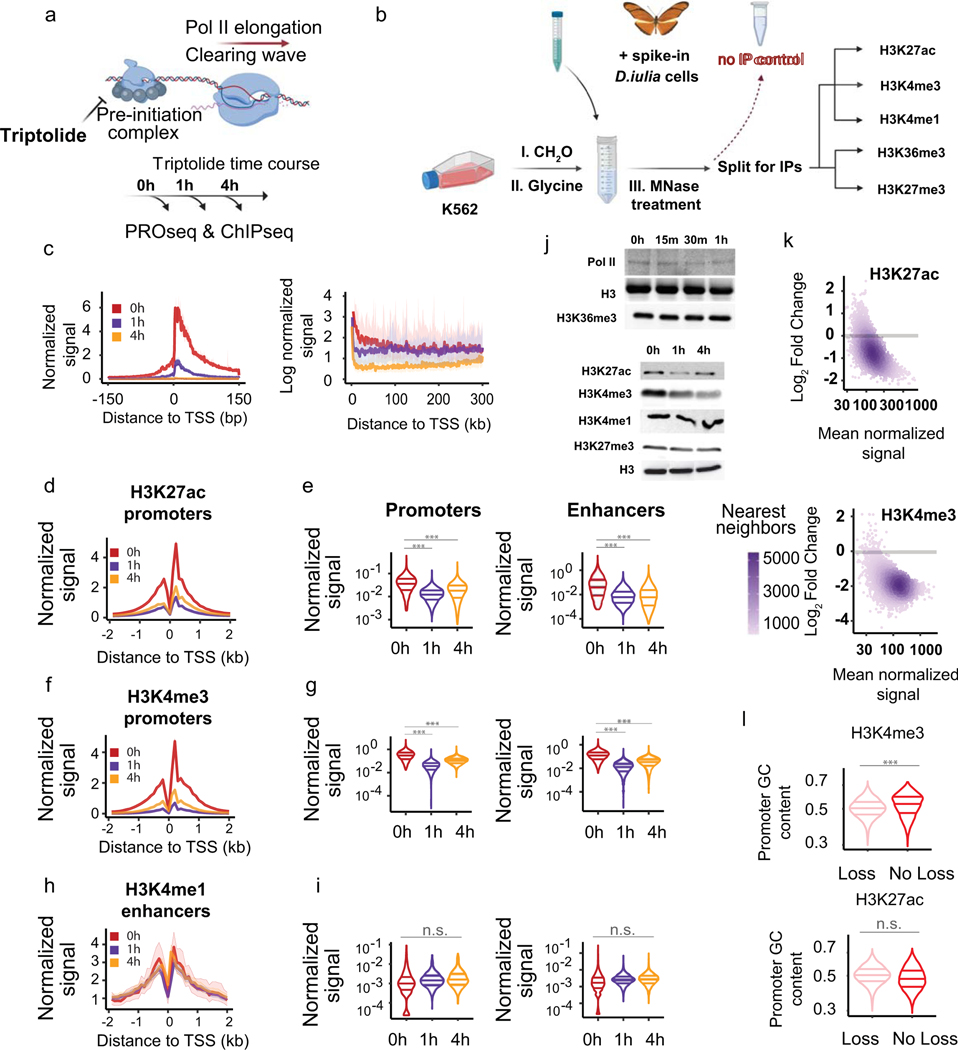
(a) Model of Trp action on transcription preinitiation complex.
(b) Metaplots of PRO-seq signal after Trp treatment. Pol II density is depicted on a linear scale in a 300-bp window centered on maximum TSS (left), or on a natural log scale (right).
(c) Depiction of ChIP-seq experimental design where D. iulia chromatin was used as spike-in normalization control. (d-i) Meta plots and quantification of H3K27ac (d-e), H3K4me3 (f-g), and H3K4me1 (h-i) signals at enhancers and gene promoters. A paired, two-sided, Wilcoxon test was performed to estimate statistical significance in signal changes, where (***) denote P value < 2.2 × 10⁻¹⁶ and (n.s.) P value = 1. The three horizontal lines denote the 25th, 50th, and 75th percentiles.
(j) Western blots show global changes in histone marks after Trp treatment. Each blot depicts chromatin associated histone marks and Pol II after the indicated Trp incubation time. See also Supplementary Figure 20.
(k) MA plots display the loss in H3K4me3 and H3K27ac between 0 h and 1 h of Trp treatment. Log2 fold-changes and mean normalized signals between time points were computed with DEseq2. A gray bar marks log2 fold-change at 0.
(l) Violin plots quantify the levels of H3K4me3 and H3K27ac as a function of GC-richness of promoter sequences. Statistical significance was computed using a two-sided paired Wilcox, where (***) denote P value < 2.2 × 10⁻¹⁶ and (n.s.) P value = 1. The three horizontal lines denote the 25th, 50th, and 75th percentiles.
Analysis of MNase-ChIP-seq data revealed that histone modifications have a broad range of dependence on Pol II. Trp had no effect on either H3K36me3 or H3K4me1 (Fig. 4d–e; Extended Data Fig. 9a–b). Although H3K36me3 is deposited co-transcriptionally46–48, it has a long half-life on chromatin49, which the 4 h time point used in our study is not likely to have captured. Surprisingly, two punctate marks, H3K27ac and H3K4me3, were rapidly lost 1 h after Trp treatment and remained low after 4 h (Fig. 4f–i, top). We note the presence of a small number (~5%) of peaks that retained the histone modification independently of transcription (Fig. 4k–l; Supplementary Note 4). Western blotting for chromatin bound modified histones confirmed the global loss in H3K27ac and H3K4me3 ChIP-seq signal, as well as the muted effects on H3K36me3 and H3K4me1 (Fig. 4j, bottom; Extended Data Fig. 9g–h). Blocking transcription also decreased the H3K27me3 repressive mark near focal binding sites of EZH2, a component of the PRC2 complex, but not H3K27me3 accumulation over broad regions away from PRC2 binding (Extended Data Fig. 9c, Supplementary Note 5). These findings are consistent with a requirement for RNA in recruiting PRC2 and depositing H3K27me350. Taken together, these results indicate a surprising and rapid dependence of histone marks on on-going transcriptional activity.
The loss of active histone modifications from chromatin may be caused by either rapid enzymatic deacetylation or demethylation of histone tails or increased nucleosome turnover at TSSs. To differentiate between these hypotheses, we focused on H3K27ac. We performed additional Western blots in cells treated with a combination of Trp and the pan-deacetylase inhibitor Trichostatin A (TSA). In the presence of Trp and TSA, H3K27ac was retained on chromatin (Extended Data Fig. 9i–j). Moreover, Trp and TSA did not have a major impact on cell viability at the time points used in our present study, indicating that effects on chromatin were unlikely to be explained by an impact on cell viability (Extended Data Fig. 10a). Collectively our results suggest that rapid deacetylation of H3K27 is responsible for the loss observed after blocking transcription.
Chromatin accessibility is insufficient for Pol II initiation
In some classical models, gene regulation in eukaryotes primarily involves removing nucleosomes from the promoter of active genes, at which point Pol II initiates in an indiscriminate manner51. More recent studies support such accessibility models by observations that Pol II initiates at nearly all DNase-I hypersensitive chromatin52,53. However, these recent studies are controversial, and at odds with other literature showing only a subset of DNase-I hypersensitivity sites have evidence of active transcription54–57. To more rigorously detect transcription at DNase-I accessible regions, we trained an SVR to impute smoothed DNase-I-seq data using PRO-seq in the same manner as we used for histone modifications. The best model predicted a holdout chromosome (chr22) with an accuracy of 0.61 or 0.77 (R2) at resolutions of 100 and 1,000 bp (Fig. 5a–c), consistent with a strong correlation between chromatin accessibility and transcription initiation31,52. Nevertheless, a substantial number of DNase-I hypersensitive sites had predicted values near zero, indicating a subset of sites that were refractory to prediction based on PRO-seq transcription data (Fig. 5a, red arrow). Intersecting experimental and imputed DNase-I-seq intensities with ChIP-seq data revealed that poorly performing windows were enriched for binding of CTCF (Fig. 5c), or to a lesser extent for transcriptional repressors and co-repressors such as REST, RFX5, or HDAC2 (Extended Data Fig. 10c–h). In contrast H3K27ac peaks were depleted for poor matches between experimental and imputed DNase-I-seq data (Fig. 5b).
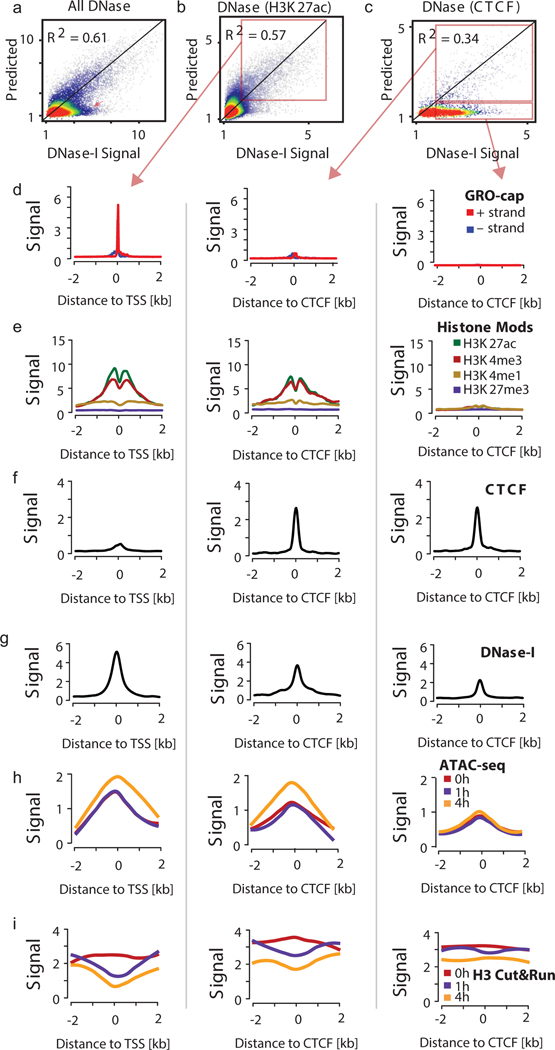
(a-c) Scatterplots show experimental DNase-I hypersensitivity (x-axis) as a function of predicted DNase-I hypersensitivity (y-axis) in 100-bp windows intersected with DNase-I hypersensitive sites.
(a), H3K27ac (b), or CTCF peaks (c) on a holdout chromosome (chr22).
(d-g) Meta plots show GRO-cap, histone modifications, CTCF binding, and DNase-I hypersensitivity signal near H3K27ac peaks in which DNase-I hypersensitivity signal was accurately predicted by transcription (left column), near CTCF peaks in which DNase-I hypersensitivity signal was accurately predicted by transcription (middle), and near CTCF peaks in which DNase-I hypersensitivity signal was not accurately predicted by transcription (right column).
(h-i) Meta plots show ATAC-seq (h) and CUT&RUN histone H3 signal (i) following Trp treatment at regions in d-g.
To confirm the absence of transcription, we divided 100-bp windows into those in which DNase-I-seq was predicted well by PRO-seq, and those for which it was predicted poorly (Fig. 5b–c, red boxes). Windows in which DNase-I-seq was predicted well by dHIT had a high signal for transcription initiation in GRO-cap data, which measures transcription initiation, and active histone modifications (H3K27ac, H3K4me3, and H3K4me1) (Fig. 5d–e). Windows in which DNase-I-seq was predicted poorly had a high CTCF signal, but virtually no evidence of transcription initiation based on GRO-cap, and weak signal for active histone modifications (Fig. 5f). Yet, despite substantial differences in histone marks, the quantity of DNase-I-seq signal was similar in these regions (Fig. 5d–g, ,i).i). Thus, a substantial portion of DNase-I accessible regions show no evidence of transcription initiation. Our analysis supports a model in which both chromatin accessibility and other aspects of the local chromatin environment, including transcription factors, pre-initiation complex machinery, chromatin remodelers, and other transcription-related proteins, are all necessary to facilitate transcription initiation by Pol II.
Chromatin accessibility does not depend on transcription
Paused Pol II is necessary for proper nucleosome positioning58, although it may not be required to establish sufficient levels of chromatin accessibility for other biological functions to take place, such as transcription factor recognition. To test the hypothesis that chromatin accessibility requires paused Pol II, we treated K562 cells with Trp to prevent transcription initiation. Unexpectedly, a time-course of Trp treatment resulted in a small but significant increase in Tn5 accessibility, measured using ATAC-seq (Figs. 5h, ,6a).6a). To more precisely examine the position of nucleosomes, we performed CUT&RUN for histone H359. We observed a loss in H3 signal inside of the nucleosome depleted region and adjacent +1/ −1 nucleosomes (Fig. 6b). Changes in ATAC-seq and CUT&RUN were specific to DNase-I hypersensitive sites that had robust evidence of transcription initiation (Fig. 5h–i). Notably, changes in both H3 and ATAC-seq signals were observed exclusively in transcription initiation regions, and did not appear in CTCF-bound and untranscribed control regions (Fig. 5h–i). We attribute the loss of histone H3 and slightly increased ATAC-seq signal to increased retention of the Pol II preinitiation complex near the transcription start site in Trp treated cells (Supplementary Note 6). Thus, we conclude that events prior to transcription initiation are primarily responsible for nuclease accessibility.
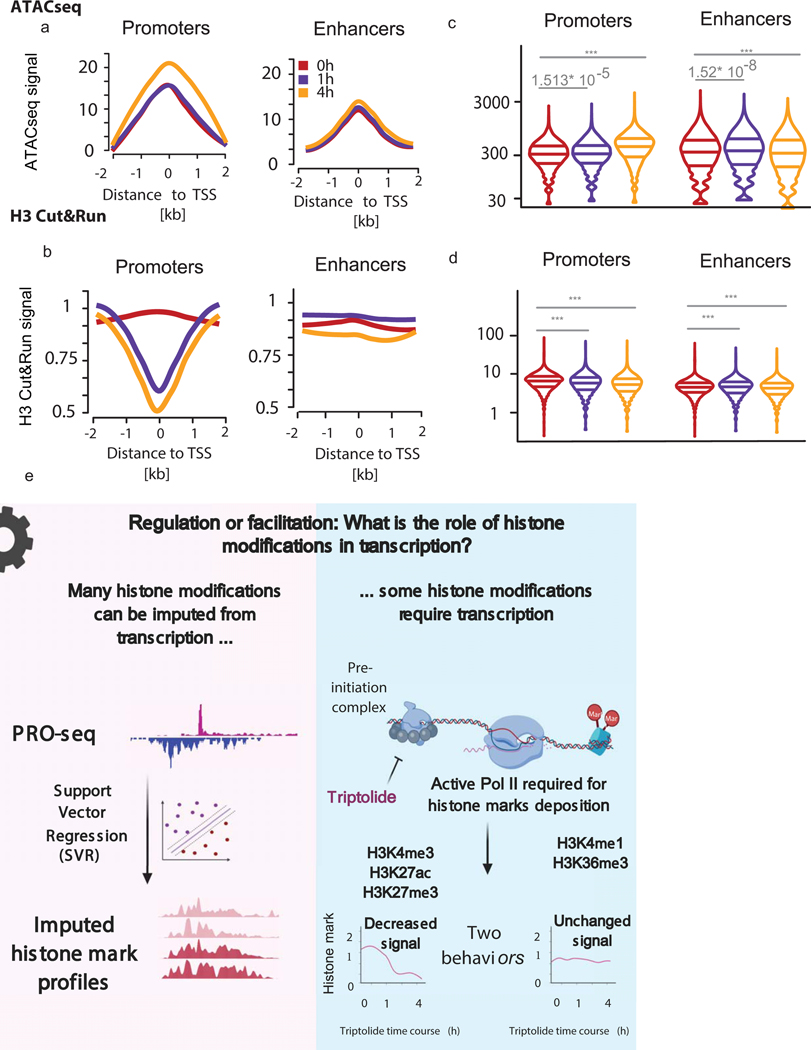
(a-b) Meta plots display ATAC-seq (a) and histone H3 CUT&TAG (b) signal measured at gene promoters and enhancers.
(c-d) Violin plots quantify the change in ATAC-seq (c) and histone H3 CUT&TAG (d) signals at gene promoters and enhancers. Significance was calculated by performing a two-sided, paired Wilcoxon test, where (***) denotes P value < 2.2 × 10⁻¹⁶.
(e) Summary figure.
Discussion
Our incomplete knowledge about the role that histone modifications play in transcription results in part from a lack of information about the precise strength of correspondence between histone modifications and transcription. Here we demonstrate that the correlation between histone modifications and transcription is nearly as strong as the correlation between biological replicates of experimental histone modification ChIP-seq data. Moreover, we likely underestimate the actual correlation between transcription and histone modifications, due to technical factors including imperfections in the model fit, low-resolution experimental procedures, and biological differences between cells cultured in different laboratories.
We observe a strong correspondence between histone modification and transcription that addresses several open questions about the biological role of histone marks. A strong correspondence is not compatible with models where histone modifications routinely “bookmark” future transcription events. Rather, our work indicates that histone marks reflect the transcription patterns active in the current cell state. Our results also suggest that different histone modifications do not interchangeably produce similar transcriptional outcomes in distinct parts of the genome (e.g., H3K122ac and H3K27ac), but serve as critical pieces of a uniform molecular machinery (i.e., cogs or gears), which are highly interconnected with Pol II and play a supportive role in transcription.
A cog model implies that the genomic distribution of histone modifications and Pol II are highly interdependent. In support of this, blocking transcription initiation for short durations (1–4 h) had rapid and large-scale effects on the genomic distribution of three histone modifications: H3K4me3, H3K27ac, and H3K27me3. Surprisingly, the loss in punctate marks, H3K4me3 and H3K27ac, was strongly correlated with loss in active transcription and coincided with a rapid loss in histone H3 at regulatory regions. This indicates that nucleosome turnover may also be involved in punctate mark depletion from promoters after Trp. However, several lines of evidence indicate that, at least for H3K27ac, mark removal by deacetylases plays a role as well. First, the loss in histone H3 does not appear large enough near the +1 or −1 nucleosome to explain the substantial depletion in punctate histone marks. Second, depletion of H3K27ac after blocking transcription was prevented by HDAC inhibitors, indicating that active transcription affects the intricate balance between the addition and removal of histone acetylation. For lysine acetylation, this result mirrors elegant complementary experiments focused on histone acetylation in yeast60. Collectively, our work supports a model in which active histone marks and Pol II are highly interconnected in the molecular machinery honed to transcribe mRNA.
Methods
Data Availability
Publicly available data used in this study can be found in the Supplementary Tables 1 and 2. Tables in csv format can be downloaded from: https://github.com/alexachivu/dHITpaper_2021 Data generated in this study can be found in Gene Expression Omnibus at GSE163043.
Code Availability
dHIT software and scripts can be found on github under: https://github.com/Danko-Lab/histone-mark-imputation.
Custom code for analyzing sequencing data can be found on github under: https://github.com/alexachivu/dHITpaper_2021/blob/main/Git.code_dHIT.upload
Experimental methods
Cell culture:
K562 cells (ATCC, CCL-243) were cultured at 37°C, 5% CO2 at a density between 0.3–1 × 10⁶cells/ml in RPMI medium (VWR 45000–396) topped up with 10% Fetal Bovine Serum (Genesee Scientific, cat: #25–514). Cells were split at a consistent interval of 3 days, when the cells reached 106 cells/ml.
Cell culture for Triptolide and Trichostatin A time course:
24h prior to drug treatments, K562 cells were resuspended in fresh (RPMI) medium at a density of 0.6 × 10⁶ cells/ml. On the day of the experiment, cells were recounted, aliquoted in equal cell numbers to T-25 or T-100 ThermoFisher Tissue Culture Flasks (each flask corresponding to one time point) and treated with Triptolide (Sigma-Aldrich, T3652–1MG) or Trichostatin A (Sigma-Aldrich, T8552–1MG). Final concentrations used in our experiments were: 500 nM Triptolide, and 250nM Trichostatin A. All drug treatments were performed for 0 min, 1h, and respectively 4h.
Cell crosslinking for ChIP:
After Triptolide treatment, K562 cells were crosslinked in 1% CH2O freshly prepared in 1× PBS on the day of the experiment to reach the final concentration of 0.1% CH2O in the media. Following a 5 min incubation at room temperature on a rocking platform, the crosslinker was quenched with 1 M Glycine to reach a final concentration of 0.135 M Glycine. Lastly, cells were washed twice in 1× PBS, then harvested and snap-frozen on dry ice.
MNase ChIP-seq - chromatin extraction:
We prepared MNase ChIP-seq data for six histone marks in K562 cells, including H3K4me1 (ab8895, lot: GR3206285–1), H3K4me2 (ab7766, lot: GR102810–4), H3K4me3 (ab8580, lot: GR3197347–1), H3K27ac (ab4729, lot: GR3231937–1), H3K36me3 (ab9050, lot: GR3257952–2), and H3K27me3 (ab6002, lot: GR3228496–2). All buffers and solutions used were provided by Cell Signaling Technology (91820S Simple ChIP kit). Crosslinked K562 cells were thawed on ice and resuspended in 1 ml cold Buffer A, mixed well, and centrifuged at 2,000× g for 5 min at 4°C. The pellet was then mixed in 0.5 ml cold Buffer B, centrifuged at 2,000× g for 5 min at 4°C and resuspended again in Buffer B. While still in Buffer B, chromatin was digested with 0.5 μl MNase for 13 min at 37°C. Tubes were inverted every 2 min during the incubation time. Finally, the reaction was stopped by the addition of 40 μl 0.5 M EDTA, and the tubes were moved to 4°C. The cell suspension got topped up with 1.5 ml cold ChIP Buffer, transferred to a 7 ml glass dounce homogenizer, and dounced ~30 times with a tight pestle to release the chromatin. The chromatin was further diluted with 1 ml cold ChIP Buffer and aliquoted to 1.5 ml Eppendorf tubes to be centrifuged at 12,000× g for 10 min at 4°C. The supernatant was collected and total chromatin quantified before each immunoprecipitation.
MNase ChIP-seq - Immunoprecipitation:
Total digested chromatin was diluted to a total volume of 1 ml in cold ChIP Buffer. ChIP samples were incubated with 3 μg anti-histone antibody at 4°C overnight rotating, then incubated for an extra 2 h at 4°C with 20 μg magnetic beads (50% protein A, 50% protein G). After incubation, samples were placed on a magnetic rack and washed three times with 1 ml Low Salt Wash Buffer for 5 min at 4°C, and three times with High Salt Wash Buffer for 5 min at 4°C. Lastly, the beads were resuspended in 150 μl Elution Buffer and incubated on a shaking Thermomixer for 1.5 h at 65°C. The eluted fractions were saved, treated with 2 μl 5 M NaCl and 10 μl Proteinase K, and incubated overnight at 65°C to reverse the crosslinker. Samples were cleaned up, the DNA quantified with Qubit, and library prep was performed using the NEBNext Ultra II DNA Library Prep Kit for Illumina (E7645S). The barcodes used were purchased from NEB:NEBNext Multiplex Oligos for Illumina (E6440S). Before Bioanalyzer and Illumina sequencing, all libraries were size-selected by being run on a 6% Native PAGE. The fragments corresponding to 200–700 bp were cut out of the gel and the DNA extracted from the polyacrylamide using 3 volumes of a DNA extraction buffer (10 mM Tris pH 8, 300 mM NaAc, 20 mM MgCl2, 1 mM EDTA, 0.1% SDS) per gram gel slice. The tubes were closed, covered with parafilm, and incubated overnight at 50°C shaking, on a Thermomixer. The following day, Spin-X columns (CLS8160, Millipore Sigma) were used to remove gel bits from the eluate, which got Phenol/Chloroform precipitated. The precipitated DNA was resuspended in a 15 μl nuclease-free H2O and the library quantified using Qubit.
Measuring chromatin-associated proteins by Western blotting:
For the Triptolide experiment, we used matched cells with the ones in the ChIP-seq experiments. The Trichostatin A Western blots were performed on cells of a different passage number. For each reaction, 500,000 K562 Triptolide-treated cells were thawed on ice, spun down at room temperature in a swing bucket centrifuge for 5 min, then washed twice in 5 ml Permeabilization buffer (10 mM Tris-HCl pH 7.5, 10 mM KCl, 250 mM Sucrose, 5 mM MgCl2, 1mM EGTA, 0.05% Tween-20, 0.5 mM DTT, 40 units/10 mM AM2694 SUPERaseIn (Thermo Scientific), 0.2% NP-40, A32963 EDTA-free (PIERCE Protease Inhibitors). During each wash cells were incubated on ice with Permeabilization Buffer for 5 min. Isolated nuclei were verified by Trypan Blue staining. Chromatin-bound proteins were isolated by centrifugation at 12,500×g for 30 min, at 4°C. After centrifugation each cell pellet was dissolved in 2× SDS loading dye and syndicated on high setting for 5 min (30 s ON: 30 s OFF). Samples were boiled at 95°C for 5 min and loaded on a 15% SDS-PAGE gel. The same antibodies used for ChIP-seq were used for western blotting. Cell Signaling Technology 9715 anti-histone H3 antibody and abcam 8WG16 anti-Pol II were also used. The molecular markers used were NEB#P7717 for Supplementary Figures 9g,i and NEB#7719 for Supplementary Figure 9h. All cropped western blots depicted in Figure 4j are presented in full in Supplementary Figure 9.
Measuring cytotoxicity of Triptolide and Trichostatin A:
Cells were grown in a 96-well plate following the “Cell culture for Triptolide and Trichostatin A time course” protocol. On the day of the experiment, cells were treated with either Triptolide alone or a Triptolide + Trichostatin A dual treatment, then incubated with almarBlue (BIORAD, BUF012A) following the BIORAD protocol. Absorbance of cells incubated with almarBlue was measured at 590 nm. The experiment was performed in two biological replicates and compared with a DMSO kill curve as positive control, and cells untreated with any drugs as positive controls.
CUT&RUN:
We measured histone H3 (Cell Signaling Technology 9715) and TBP (ab818) levels on chromatin following a time-course of Trp treatment using the High Ca2+ / Low Salt CUT&RUN protocol (https://dx.doi.org/10.17504/protocols.io.zcpf2vn). Each experiment was performed with 250,000 K562 cells.
ATAC-seq:
K562 cells were treated with Triptolide and a total of 500,000 cells per condition were used for ATAC-seq. After Triptolide treatment, cells were washed in 1× PBS, then lysed in 1 ml cold Lysis Buffer (10 mM Tris-HCl pH 7.4, 10 mM NaCl, 5 mM MgCl2, 0.2% NP-40) while incubating for 3 min on ice. The lysis buffer was removed by 10 min centrifugation at 600×g, 4°C, and cell pellets were resuspended in 48.5 μl Transposition Buffer (10 mM Tris-HCl pH 7.4, 10% DMF, 5 mM MgCl2). 1.5 μl in-house purified Tn5 (stock concentration 3.5 μg/μl) was used per reaction. The transposition took place for 30 min at 37°C while shaking. Phenol/Chloroform was used to extract transposed DNA which was further PCR amplified to add NExtera sequencing adapters.
PRO-seq library prep:
New PRO-seq or ChRO-seq libraries were prepared from cultured K562 cells, and from equine liver tissue samples. We prepared PRO-seq libraries in K562 cells, matched to the MNase ChIP-seq. Drosophila melanogaster, S2 cells, were used as heterogeneous spike-ins and added to each sample before the run-on in a ratio of 1:10,000 = S2:K562 chromatin.
Data processing for newly collected MNase ChIP-seq, CUT&RUN, ATAC-seq, and PRO-seq
We used hg19 as the primary genome assembly in our data analyses to facilitate comparisons with ENCODE data (which primarily used the hg19 assembly at the time these analyses were conducted). Data from each experiment were aligned to genome assemblies as following:
MNase ChIP-seq reads were aligned to hg19 merged to D. iulia assembly61,62. All positions with sequence similarity between the two genomes were masked using bedtools maskfasta;
ChRO-seq reads were aligned to hg19 merged to the D. melanogaster dm3 genome assembly. All positions with sequence similarity between the two genomes were masked using bedtools maskfasta;
CUT&RUN reads were aligned to hg19 merged to Saccharomyces cerevisiae SacCer1;
ATAC-seq reads were only aligned to hg19.
Masking hg19 was performed with BedTools maskfasta63. All sequencing data were aligned using bowtie2 version 2.3.5.164 with parameters: --no-discordant --no-dovetail --no-unal --no-mixed. Reads mapping multiple times were removed with samtools view65, parameter: -F 256. The remaining reads were converted to paired-end BigWig files using BedTools and visualized in the WashU genome browser version 46.266,67.
ChIP-seq normalization strategy (for MNase-seq triptolide time course):
In our experiments, both the human and spike-in samples were mixed and treated with MNase together, before the antibody incubation. To correct IP signals for biases in MNase cutting efficiency, handling, and other errors, we used the spike adjusted procedure (SAP) method68. Briefly, we assume that ChIP-seq data reflect a linear combination of three factors: signal from the mark of interest, background that may be partially correlated with the mark, and random noise. SAP assumes that the background signals should be the same in treated and untreated samples and enforces this assumption by subtracting the expected background read count observed in the input. Because the data are noisy and we cannot assume input samples are sequenced deeply enough to estimate the background directly, SAP subtracts the expected background estimated using a linear regression fit in background regions. The details of this full procedure are described in Supplementary Note 7.
CUT&RUN normalization strategy:
A total of 2.5 pg/ml final concentration of S. cerevisiae MNase-fragmented DNA was added as spike-in control to each CUT&RUN experiment. After aligning all reads to a merged human and yeast genome, we determined the total number of yeast reads in each sample. For normalization purposes, we divided the human tags by the total number of yeast tags in each particular sample.
ATAC-seq normalization strategy:
To account for changes during handling and sequencing of ATAC-seq libraries, we consider a constant background level between conditions. The background was estimated as the total number of tags mapping to gene-desserts, PRO-seq untranscribed, and Tn5-inaccessible coordinates in the human genome. To normalize, we divided the tags in a given sample by its respective background tags.
PRO-seq normalization strategy:
Chromatin from D. melanogaster S2 cells was used as a spike-in internal control in a 1:10,000 [ng:ng] human:fly ratio. As normalization, we divided the human tags in each sample by the total number of tags aligning to the fly genome from that particular sample.
Maximum transcription start sites, as defined in Tome, Tippens and Lis, 201829, were used to draw meta profiles of ChIP-seq, PRO-seq, CUT&RUN, and ATAC-seq signals.
Training dHIT SVRs to predict histone marks using PRO-seq, GRO-seq or ChRO-seq data
Overview:
The primary goal of dHIT is to map the signal intensity and “shape” in a run-on and sequencing dataset (PRO-seq, GRO-seq or ChROseq; henceforth referred to simply as PRO-seq) to the specific quantity of a histone modification at each position in the reference genome. The dHIT algorithm passes standardized read count data to a support vector regression (SVR) classifier. During a training phase, the SVR model optimized an objective function which mapped PRO-seq signal to the quantity of ChIP-seq signal at each position of the genome. Once a dHIT model is trained using existing ChIP-seq data, it can impute steady state histone modifications in any cell type, provided that the relationship between histone modification and transcription is preserved. The dHIT software package is provided at https://github.com/Danko-Lab/histone-mark-imputation.
Training dataset:
All data used for training were evaluated for quality content using PEPPRO69. We trained each model using five different run-on and sequencing datasets that were generated by different laboratories, thereby reducing the potential for overfitting to batch-specific features of a single dataset (see Supplementary Table 2)25. Training data were distributed between PRO-seq and GRO-seq data. Sequencing depth of the training data ranged from 18 to 374 million uniquely mapped reads, and all five training datasets were highly correlated when comparing RPKM normalized read counts in gene bodies25.
We trained SVR models for ten different histone modifications in K562 cells, primarily using data from the ENCODE project23, all of which passed the ENCODE 2 data quality standards70. Data for H3K122ac ChIP-seq in K562 cells were obtained from a recent paper19. Lastly, we trained models to recognize high-resolution ChIP-seq data using an MNase ChIP-seq protocol for H3K4me1, H3K4me2, H3K4me3, H3K27ac, and H3K36me3. For validation in holdout cell types, we obtained ChIP-seq data from six additional cell types from a variety of sources. All training and validation analyses used sequencing depth normalized read counts, where possible using bigWig or bedGraph files provided by the original authors as input. All ChIP-seq data used in training or for validation are listed in Supplementary Tables 1 and 2.
SVR feature vector:
We passed dHIT PRO-seq data from non-overlapping windows of multiple sizes that were centered on the position for which ChIP-seq signal intensity was being imputed. We have previously optimized the number of window sizes and the window sizes for optimal classification of TIRs using dREG25,54. Since the imputation of histone modifications uses signals in the PRO-seq data that are similar to dREG, we used the values that were optimal for dREG without modification. Like for dREG, we passed data from windows at multiple size scales, including 10, 25, 50, 500, and 5,000 bp windows (n = 10, 10, 30, 20, and 20 windows, respectively), representing read data as far as 100 kb from the genomic region in question. PRO-seq data were standardized across each length scale in a similar fashion as we use for dREG54, using a logistic function, F(t), to transform raw read counts using two free parameters, α and β:
Where t denotes the read counts in each window. Tuning parameters α and β were defined in terms of two parameters, x and y. Intuitively, y gives the value of the logistic function at a read count of 0, and x represents the fraction of the maximal read count at which the logistic function approaches 1. Values of x and y are related to the parameters α and β by the following equations:
We have previously found that x = 0.05 and y = 0.01 optimized the discovery of transcription initiation regions (TIRs)54, and these values were used throughout this study.
Selecting training positions:
We trained models using 3 million training examples divided evenly among five K562 training datasets (n = 600 thousand positions in each dataset). In all cases, human chromosome 22 was excluded from training to use as a holdout.
We found it convenient to use heuristics that identify regions with a high PRO-seq signal intensity when choosing training samples. We defined regions of potential PRO-seq signal, which we call “informative positions” using the same heuristics we described previously for dREG54. Each window was defined as an “informative position” when the window had more than 3 reads within 100 bp on the single strand or at least one read within 1,000 bp on both the positive and negative strands. These heuristics were selected as a way to optimize the tradeoff between the number of positions analyzed and the fraction of real TIRs that were scored based on the overlap with GRO-cap peaks. Within the five training datasets, informative positions accounted for 27.3% (855.9M), 6.7% (209.4M), 14.7% (460.0M), 13.8% (433.9M), and 9.4% (294.0M) of 10-bp windows, respectively.
Training examples were selected at random, according to the following criteria: In order to increase the frequency of windows with a strong signal intensity in the training dataset, we selected 5% of the training data from positions in the informative positions pool (defined above) that also intersected a transcription start site (TSS), defined using GRO-cap55, and a DNase-I hypersensitive site23, 93% from the non-TSS informative sites, and the remaining 2% from the non-informative position pool. This was done to enrich the frequency of GRO-cap TSSs (these were 0.78% of hg19), and to increase the frequency of regions with substantial PRO-seq signal intensity, in the training dataset.
Training computations were conducted using Rgtsvm, a fast, GPU-based SVR implementation71. We trained 3M samples with 360 features for each sample from 5 data sets with an average training time of 27.9 hours (18.0~37.8 hours) on an NVIDIA Tesla TITAN XP GPU. Training achieved an average Pearson correlation of 0.48 (0.109~0.725) on holdout positions that matched the training dataset at 10-bp resolution.
SVR imputation:
We imputed histone modifications every 10 bp using the run-on and sequencing datasets outlined in Supplementary Table 2. We tested the accuracy of imputation on human chr22 (which was withheld during training) in four holdout cell lines HCT116, HeLa, and CD4+ T-cells72–74. Imputation was conducted using ChRO-seq data from 20 primary glioblastoma cases22. We also imputed data from two additional mammals: mouse embryonic stem cells (mESCs)37 and horse liver (new data). Computing imputed values on human chr22 (5.1M loci) took 3–5 hours on a Tesla TITAN XP GPU.
Training models that impute histone marks using other histone marks
We selected 1M samples from chromosome 1 to train SVR models in which histone marks were used to predict other histone marks. In order to make a fair comparison with models trained to predict histone marks using PRO-seq data, we also trained new models from PRO-seq (using the dataset G1) using 1M samples. To select training positions when training models using histone marks, we calculated the maximum read count in every 50-bp windows on chr1 (4.99M regions), and selected 1/3 of the samples from regions that contain more read counts than median value in either the training or the experimental data (for instance, if using H3K4me1 to predict H3K4me3, we selected 33% of training positions that had higher read counts than the median H3K4me1 or H3K4me3 signal). We selected another 1/3 from regions, which contained read counts that were less than 20% of the median value in either the training or the experimental data. We selected the last 1/3 of the training regions from remaining regions at random. To obtain training datasets when multiple histone marks were used to jointly predict a histone mark, we merged multiple experimental histone mark data together and sampled windows as described above. The feature vector and standardization for histone marks were identical to those used for PRO-seq data (see above). When generating the feature vectors for multiple histone marks, we concatenated the feature vectors extracted from multiple experimental histone marks together.
We compared the difference between imputation and original experimental data using the L1 norm, by median centering and scaling each dataset, as follows:
Where xi is the imputed signal, and yi is the experimental signal for a particular comparison, and i represents the set of all genomic positions on chr22. We use sd() to denote the standard deviation of the mark.
Computing performance metrics using dHIT SVRs
Imputed profiles for 10 histone modifications in seven cell lines were compared to a variety of publicly available and newly generated ChIP-seq data available from ENCODE, Epigenome Roadmap, and a variety of other sources, as outlined in Supplementary Table 1. When measuring correlations, we subtracted the background (median) value from all positions, and applied a series of filters that were designed to remove artifacts of mappability or repeat content. Filters used to compute correlations include: 1) We masked all positions in which 30 bp, the size of many of the older ENCODE ChIP-seq datasets, cannot map uniquely to the reference genome; 2) We removed ENCODE blacklist regions annotated on hg1975; 3) We identified and masked “spikes” in the data, caused by putative experimental or mapping artifacts, that were not filtered by the above two criteria. Our filter identified blocks with a high signal intensity (top 2%) for which the sum of the absolute value of the two maximal derivatives was higher than the number of read counts in the region (i.e., [abs(d1) + abs(d2)] > h, where d1 and d2 are the maximal and second highest change in ChIP-seq signal intensity, and h is the total read density between the positions at which d1 and d2 occur). When comparing performance metrics between two experimental datasets, this filter was applied to both ChIP-seq datasets.
After masking the types of regions indicated above, we divided the whole genome or the entire chromosome into four granularities: 10-bp, 100-bp, 1,000-bp, and 10,000-bp windows. After collecting the sum of the read counts from experimental data and imputed data in each window, we compared the relationship between two datasets using four statistics: Pearson correlation, Spearman correlation, MAD, and JSD. Windows with 0 counts were removed from estimates of Pearson and Spearman correlation when using 10-kb windows, as large regions without any ChIP-seq signal were likely driven by mappability issues.
To evaluate the accuracy of dHIT, we computed alternative performance metrics including MSE quantification at different subsets of genomic sites, as well as ROC and PRC curves for the recovery of peak calls. We added precision recall curves (PRC) following the setup introduced by Nair et al. (see ref76), in which we divided the holdout chromosome into 500-bp non-overlapping windows from which we exacted ground truth labels using cell type specific peak calls generated by ENCODE. We generated PRCs or ROC curves by thresholding the imputed histone modification signal intensity to divide the same windows into those predicted to be enriched/ not enriched for each histone mark. To provide additional context for the PRC or ROC curves, we also computed PRC/ ROC curves in the same manner from experimental data. All analyses focus on the holdout chromosome (chr21) in the holdout cell type (GM12878).
We computed mean-squared errors (MSE) following performance metrics similar to those presented by Durham et al. and Schreiber et al. (see ref26,27). We computed MSE in different genomic regions, including the top 1% of imputed windows (MSEimp); and the top 1% of experimental windows (MSEobs), two independent definitions of promoter and enhancer, using either proximity to gene annotations (GENCODE) or the stability of the transcription unit produced by each annotation following the nomenclature detailed in ref55.
ChromHMM analysis
Chromatin state annotations were generated using ChromHMM38. We used the 18 state core model (model_18_core_K27ac) trained using ENCODE data10, because we had already imputed all of the histone modifications used in this model. To convert imputed histone modifications into data that met the requirements of ChromHMM, we fit the sum of imputed signal in 200-bp windows to a Poisson distribution, and identified windows with values higher than the 0.999th quantile. Chromatin segmentation was performed using the MakeSegmentation command, following the instructions from the authors39. We also made chromatin segmentations using an alternative source of experimental data for six histone marks, including H3K27ac, H3K27me3, H3K36me3, H3K4m1, H3K4me3, and H3K9me3 from ENCODE and other sources, as outlined in Supplementary Table 1. Chromatin segmentations were compared between experimental datasets, and between imputed and experimental data, using the Jaccard distance between each pair of states77. All computations were performed with bedtools63. When comparing enrichments of each state to those expected at random, we randomized the position of each state using bedtools random.
Predicting bivalent TSSs
Bivalent genes in mESCs were identified using data from ref.78 and converted into mm9 coordinates using liftOver. Bivalent transcription start sites were predicted using a random forest. We used features representing H3K4me3 within 1,000 bp in 250-bp bins and H3K27me3 within 60,000 bp in 15,000-bp bins surrounding each promoter. All imputed histone modification data were based on models trained in K562 cells. We trained on a matched set of 100 bivalent and 100 non-bivalent promoters. The model was tested on a random set of 100 bivalent and 100 non-bivalent promoters that excluded promoters held out during training.
Classification of H3K27me3 distribution
We obtained data from 86 H3K27me3 datasets from the Roadmap Epigenome Project (Data sources listed in Supplementary Table 4). Data from each sample were classified using a systematic approach designed to represent the degree to which each sample appeared to fit either the broad or punctate distribution of H3K27me3. Briefly, data from chromosome 21 were split into 10-kb non-overlapping bins. The amount of H3K27me3 signal was counted in each bin. Bins from each sample were placed in descending order based on the read counts in that bin. The top and bottom 0.5% of bins were removed from each dataset and data were normalized to the total number of reads. Finally, we conducted a principal component analysis. We confirmed by manual inspection that principle component 1, accounting for 95.56% of the variance in the data, corresponded to the degree to which each sample showed a “punctate” or “broad” pattern. The value of principal component 1 in each sample was used in downstream analyses as a surrogate for the punctate and broad pattern. To compare the differences in patterns through differentiation, we manually categorized each of the 86 datasets as either pluripotent, multipotent, fetal, or adult/somatic primary cells. We compared values of principal component 1 across these groups using a two-sided Wilcoxon rank sum test in R.
Extended Data
Extended Data Fig. 1
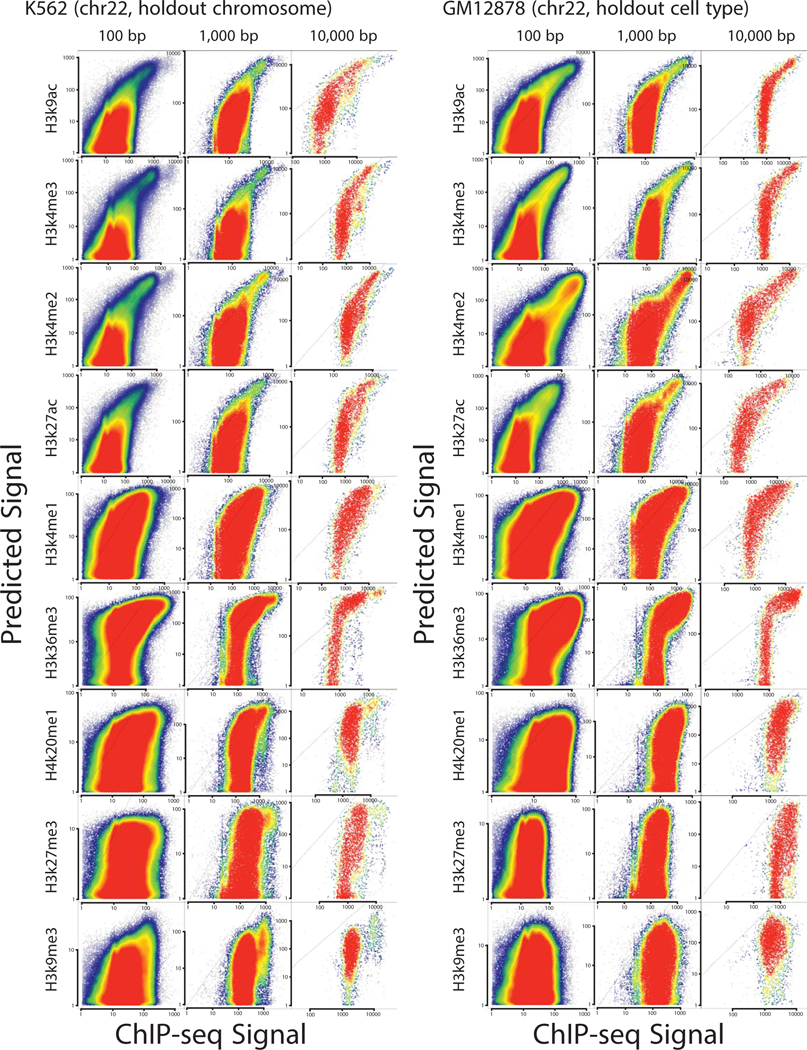
Scatterplots show predicted (Y-axis) as a function of experimental ChIP-seq signal (X-axis) for ten different histone modifications in K562 and GM12878. Plots show correlations in a holdout chromosome (chr22) at three distinct length scales.
Extended Data Fig. 2
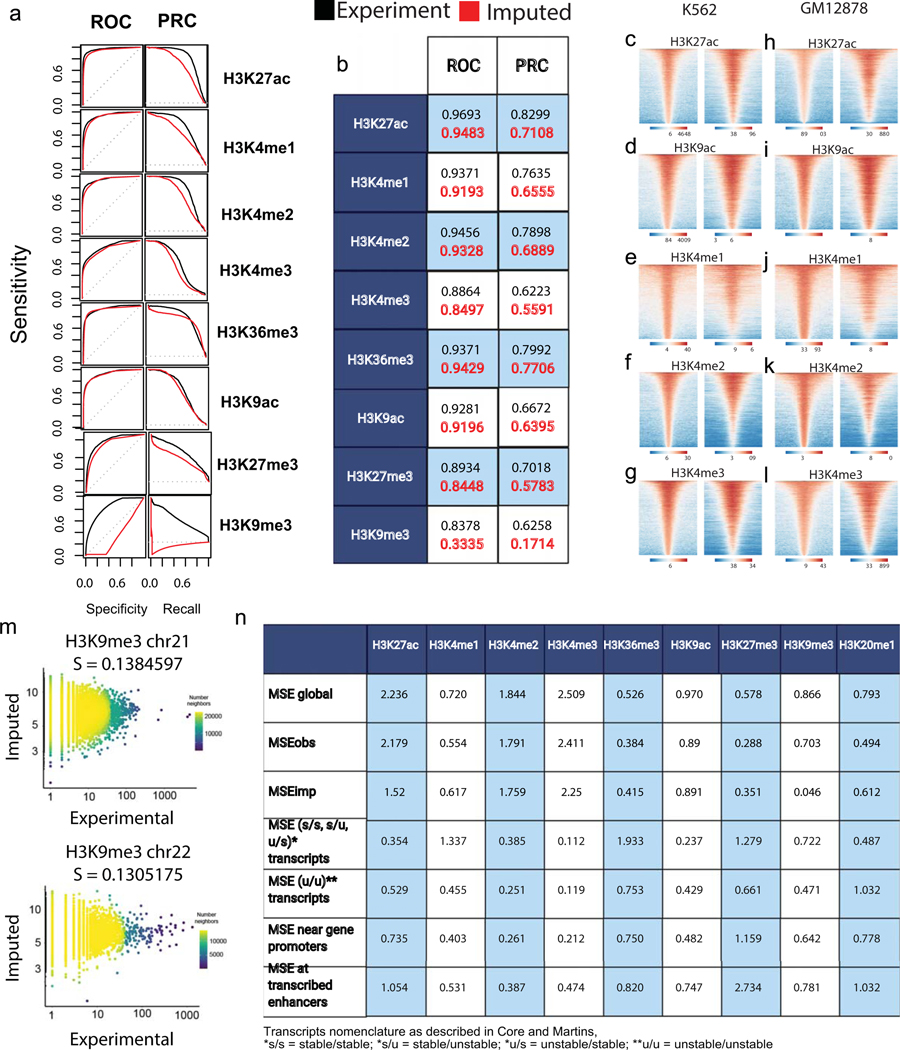
A.ROC and PRC plots describe the relationship between imputed and ENCODE ChIPseq data within ENCODE peaks on chr21, holdout during dHIT training.
B. Quantification of area under precision curves for both ROP and PRC plots in A.
(C-L) Heatmaps show the experimental and imputed abundance of active, punctate histone marks in K562 (C-G) or GM12878 (H-L). Heatmaps show all peaks calls based on experimental ChIP-seq data ordered by the highest total signal intensity.
M. Scatter plots depict imputed H3K9me3 (Y-axis) as a function of CUT&TAG experimental (X-axis) for H3K9me3 in K562. Spearman correlations were computed on the holdout chromosome chr21 (A) and chr22 (B).
N. Mean-squared error (MSE) quantification at different subsets of genomic sites in GM12878.
Extended Data Fig. 3
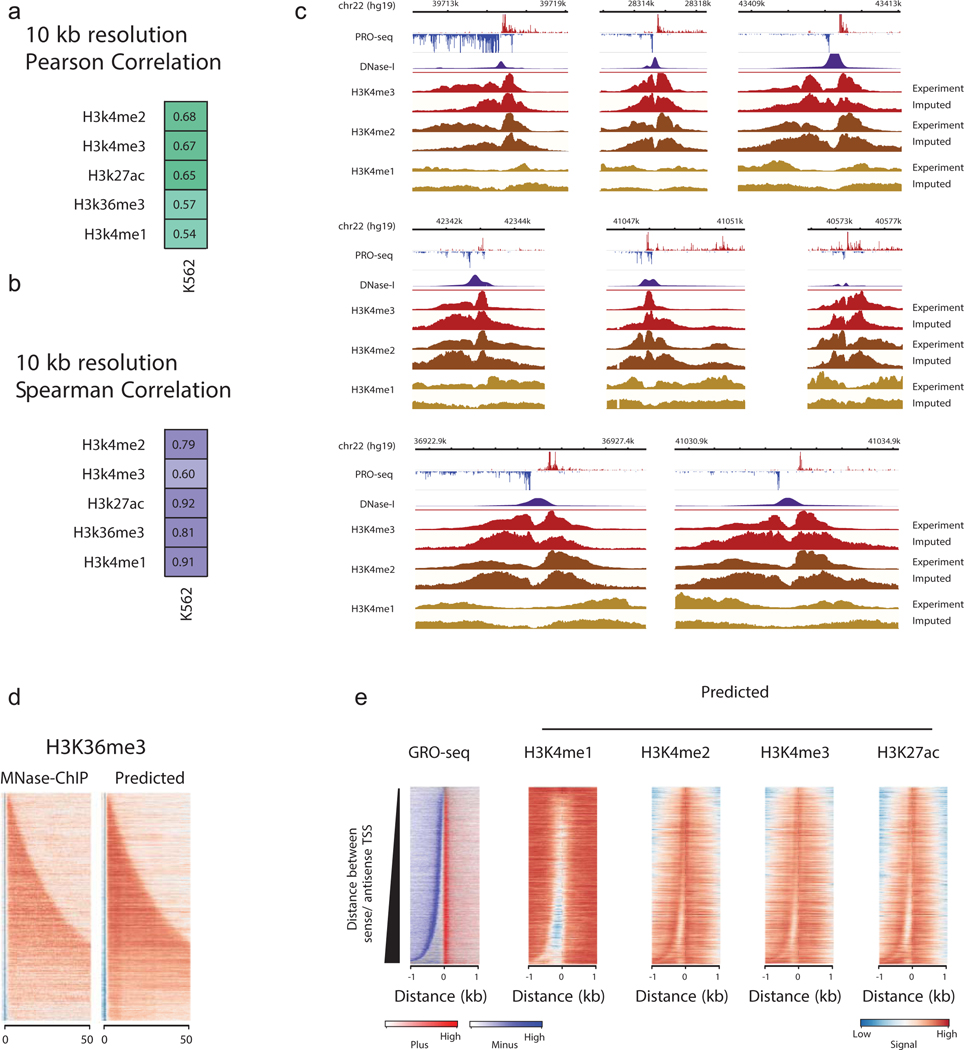
(A-B).Heatmaps show the Pearson (A) and Spearman (B) correlations between predicted and experimental MNase ChIP-seq in 10kb windows on a holdout chromosome (chr22).
C. Genome-browser plots show the distribution of PRO-seq, DNase-I hypersensitivity signal, and the signal for H3K4me3, H3K4me2, and H3K4me1 derived from MNase ChIP-seq and imputation near 9 transcribed regions in K562 cells.
D. Heatmaps show MNase ChIP-seq and imputed signal intensity for H3K36me3, a gene body mark, deposited in the body of annotated genes. Genes are sorted by gene length.
E. Heatmaps show the distribution of transcription (left) and histone modifications (right) predicted using transcription. Rows represent transcription initiation domains in GM12878 cells defined using GRO-cap data by Core, Martins, et. al. (2014) Nat. Gen. Heatmaps were ordered by the distance between the most frequently used TSS in each transcription initiation domain on the plus and minus strand.
Extended Data Fig. 4
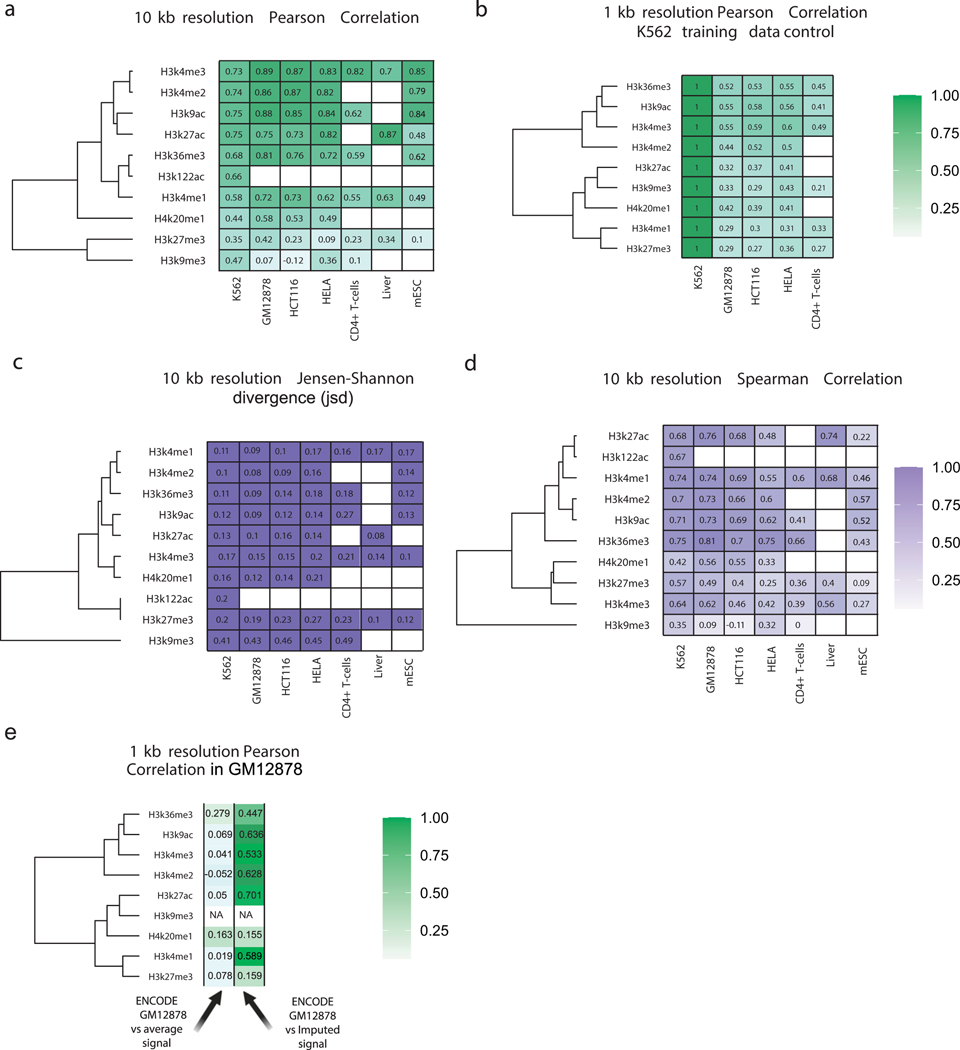
(A-C) Heatmaps show Pearson’s correlation (A), Spearman’s rank correlation (B), Jensen-Shannon and divergence.
(C) between predicted and ChIP-seq measurements of nine histone modifications. Values are computed in 10kb windows on the holdout chromosome (chr22) in humans, chr1 in horse, and chr1 in mice. Empty cells indicate that no experimental data is available for comparison in the cell type shown.
(D) Heatmap shows Pearson’s correlation between the training dataset in K562 cells and experimental data collected in the indicated human cell line. Values are computed in 1kb windows on the holdout chromosome (chr22) in humans.
(E) Heatmap shows Pearson’s correlation between the ENCODE experimental data and either Imputed data or the average signal of the other human cell lines investigated. Values are computed in 1kb windows on the holdout chromosome (chr22) in GM12878.
Extended Data Fig. 5
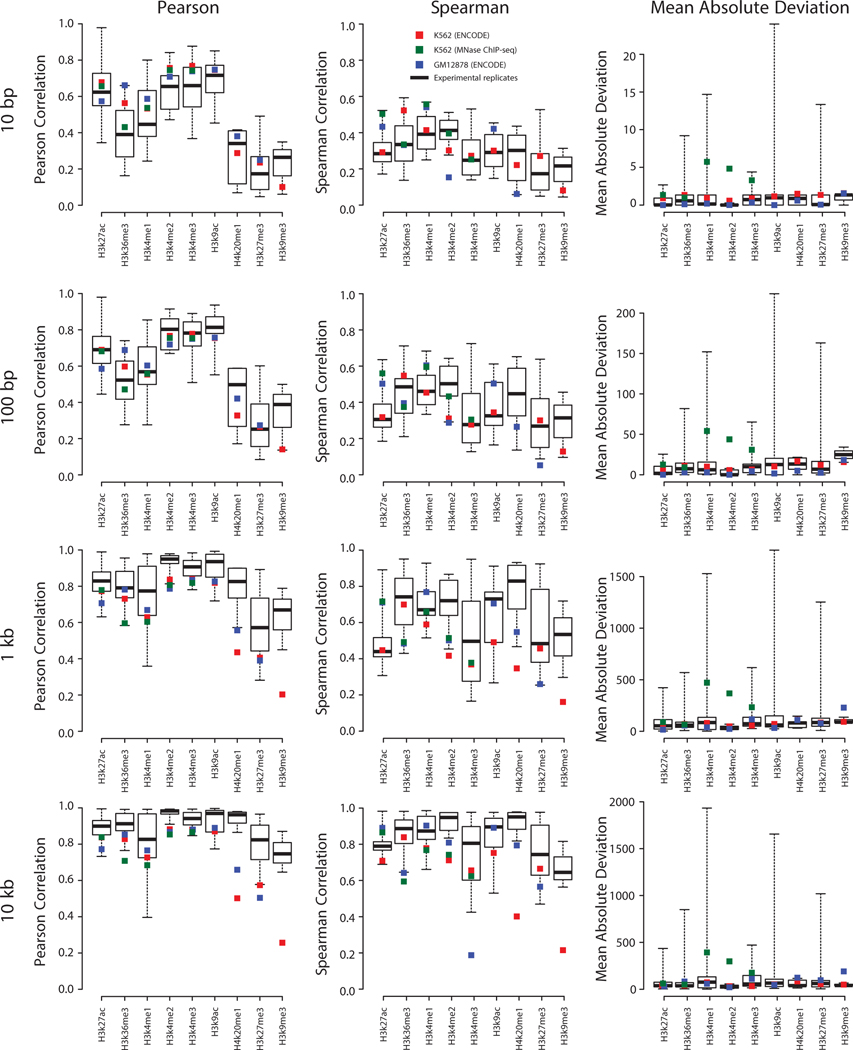
Box and whiskers plot shows the Pearson correlation between different experimental datasets for six histone marks in K562 and GM12878.The correlation between data imputed in K562 and GM12878 and the ENCODE experimental data in the same cell line is shown respectively by red and blue squares. All values are computed on a holdout chromosome (chr22) not used during training and are presented as mean values +/- standard deviation.
Extended Data Fig. 6
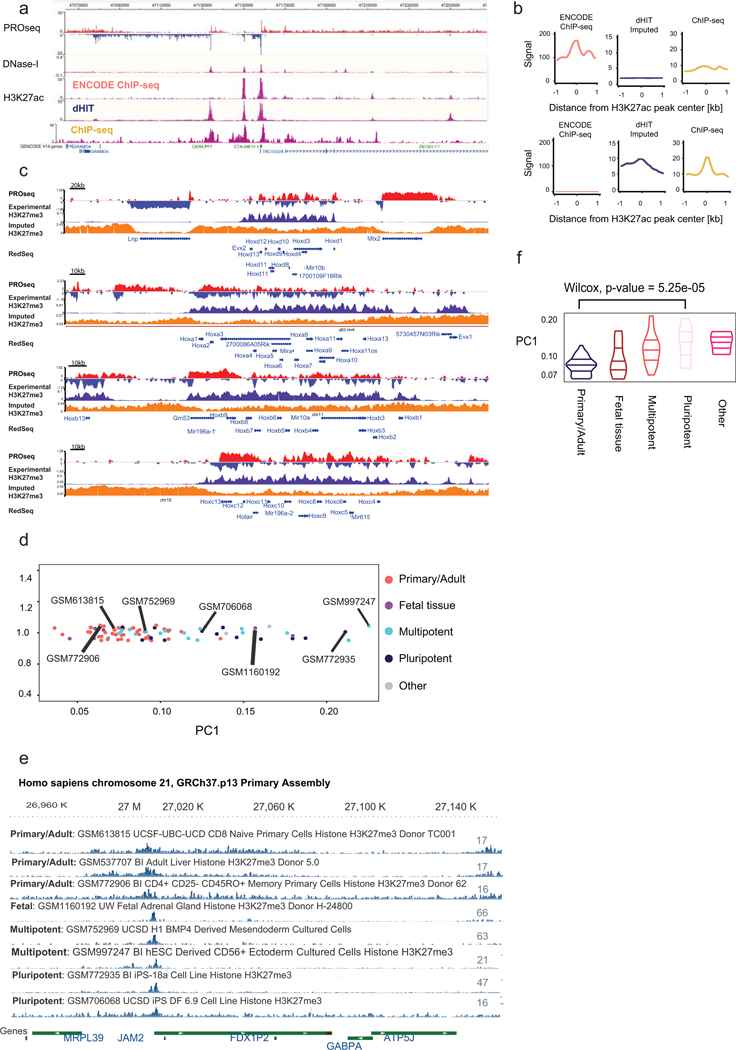
A. Broser shot shows the ENCODE, imputed, and experi-mental ChIP-seq signals at the CERK locus.
B. Meta plots compare the H3K27ac content of two different sets of H3K27ac annotated peaks: peak high in ENCODE signal and depleted in imputed ChIP (top) or vice-versa (bottom).
C. Genome-browser compares experimental and predicted H3K27me3 signals at all four Hox gene clusters in relation to PROseq signal.
D.Principal component analysis of 86 H3K27me3 ChIP-seq datasets from the Epigenome Roadmap project.
E.Genome browser shows the distribution of H3K27me3 in the 8 of the Epigenome Roadmap cell lines.
F.Quantification of PC1 H3K27me3 signal in 5 classes of cells. An unpaired Wilcox test was usedto compare the Primary/Adult to the Pluripotent classes.
Extended Data Fig. 7
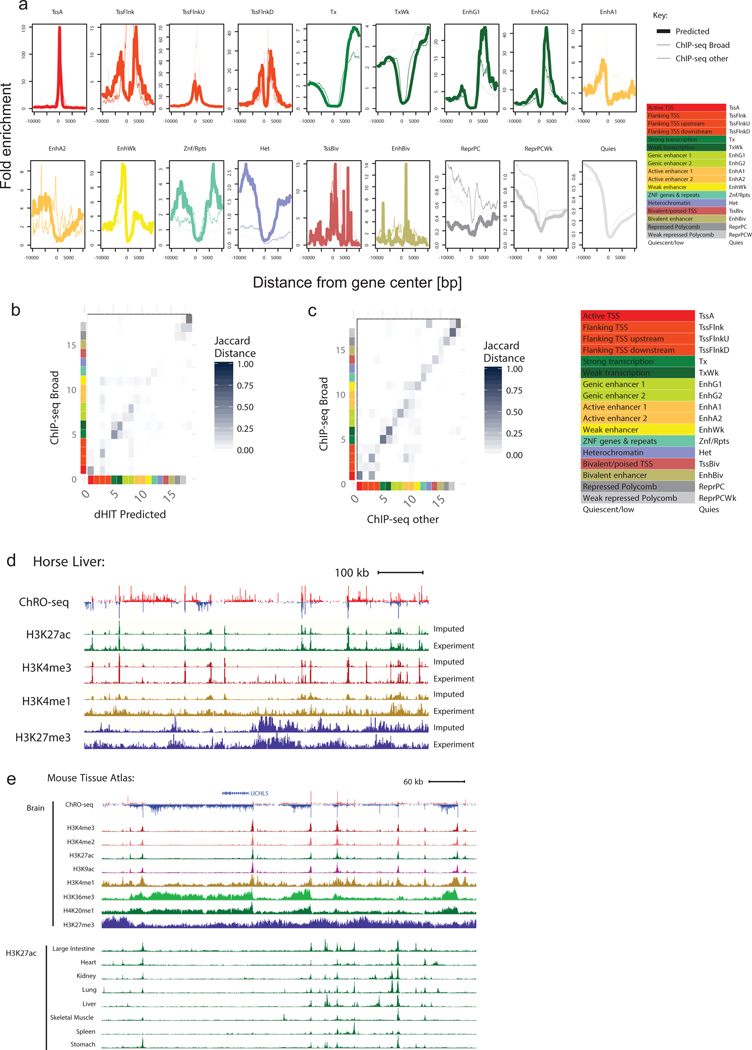
A. Enrichment of 18 chromatin states near RefSeq annotated transcription start sites for histone abundance predicted by dHIT (thick solid line), ChIP-seq from Broad (thin solid line), or using an alternative source of ChIP-seq data (thin dashed line).(B-C). Confusion matrix shows the Jaccard distance between dHIT and ChIP-seq data in 18 chromatin states (B) or between two separate sources of ChIP-seq data (C). Color scales are shown beside the plot, and are identical between panels (B) and (C).
D. Genome browser shows the distri-bution of transcription, H3K27ac, H3K4me3, H3K4me1 and H3K27me3 in equine liver.
E Genome browser shows the distri-bution of eight histone marks in mouse brain (top) and H3K27ac across nine murine tissues (buttom).
Extended Data Fig. 8
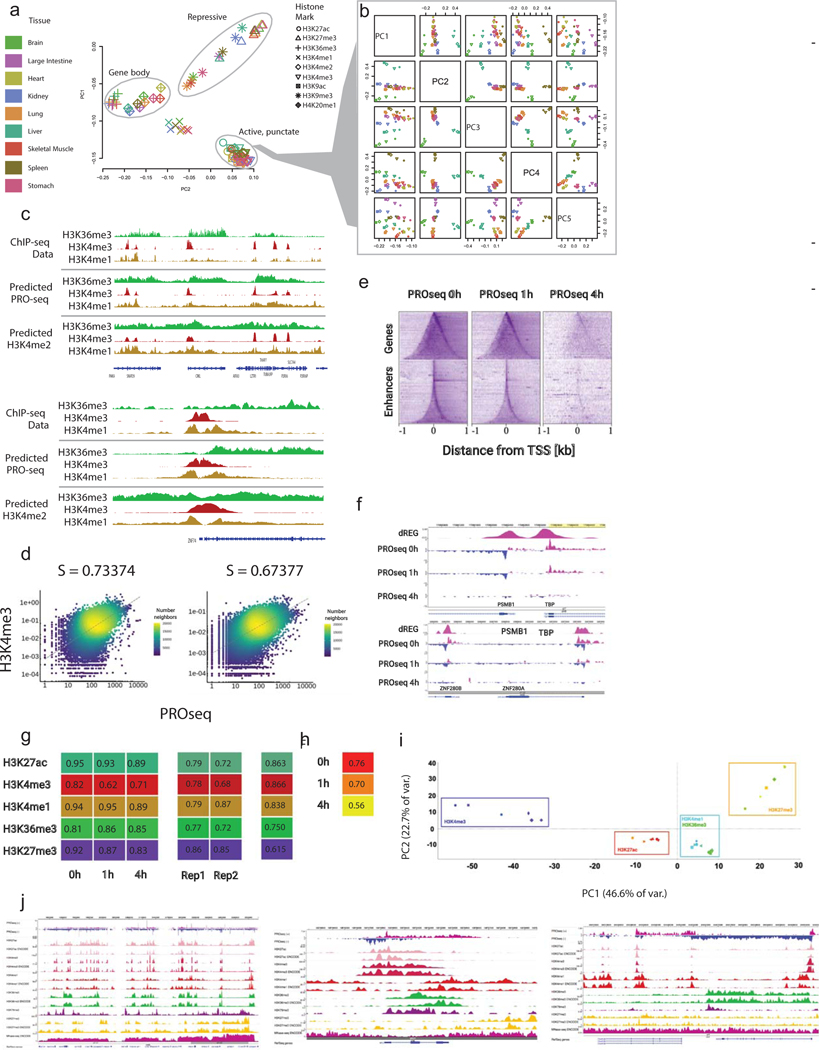
A. PCA shows the first two princi-pal components of nine histone modifications in nine murine tissues (81 total datasets) in 100 bp bins on mm10 chr1.
B. PCA of active, punctate marks (H3K4me3, H3K4me2, H3K9ac, and H3K27ac) shows that active punctate marks cluster by tissue.
C. Genome browser shows the distribution of H3K36me3, H3K4me3, and H3K4me1 observed using ChIP-seq experiments or predicted using either PRO-seq or H3K4me2. Data is shown in two loci covering sever-al transcribed genes (top) and near the transcription start site of ZNF74 (bottom).
D. Correlations between PROseq 0h and H3K4me3 and H3K27ac at TSSs.
E. Heatmaps centered on transcription initiation domains show loss in transcription measured by PRO-seq after Trp treatment.
F. Genome-browser shows loss in transcription measured by PRO-seq after Trp treatment. Loss in PRO-seq signal at both enhancers and gene promoters.
G. Spearman correlations between ChIP-seq replicates (left), each ChIP-seq replicate and ENCODE data (middle) genome-wide at 10kb resolution, and at ENCODE peaks between merged Reps and ENCODE.
H. H3 Cut&Run 10kb resolution Spearman correlation between replicates.
I. Genome-wide, 10kb resolution PCA of all ChIP-seq samples.
Extended Data Fig. 9
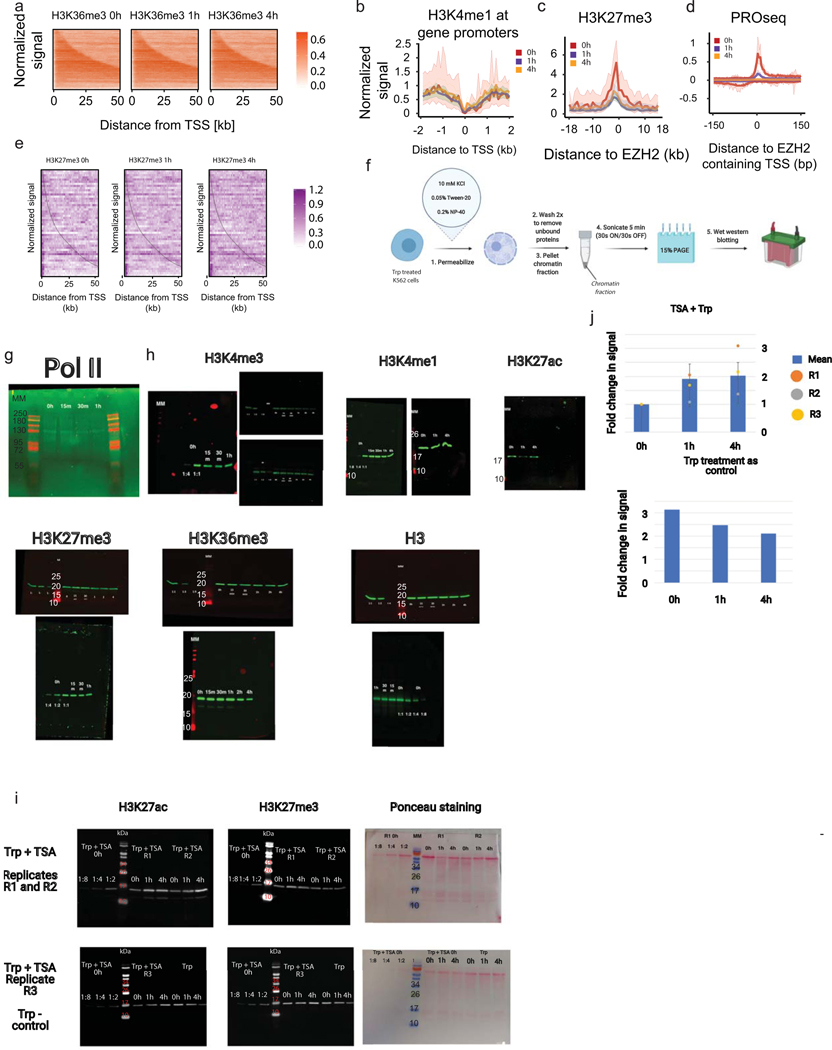
A. Heatmaps compare the level of H3K36me3 ChIP-seq after Triptolide inhibition.
B. Meta plots show the H3K4me1 levels in a 4kb window centered on transcription start sites in K562 cells.
C. Meta plots show the level in H3K27me3 in a 40kb window centered in EZH2 binding sites.
D. Meta plots show transcription content of EZH2 binding sites during the Triptolide time course.
E. Heatmaps shows H3K27me3 signal within gene bodies during the Triptolide treatment. Genes are sorted by gene length.
F. Schematics of western blot experimental design.
(G-H). Each western blot depicts the abundance of chromatin bound histone mark or Pol II during the indicat-ed Triptolide incubation time point. Each blot represents a different experiment. A dilution series of the untreated samples was used as standard curve to quantify changes in signal. Experiments were repeated at least twice and a minimum of 2 replicates per histone mark are provided. MM defined the Molecular marker depicted in [kDa].
I. Each western blot depicts the abundance of chromatin bound H3K27ac or H3K27me3 during the indicated incubation time point of Triptolide, or Triptolide and Trichostatin dual treatment. Each blot represents a different experiment. A dilution series of the untreated samples was used as standard curve to quantify changes in signal. Ponceau staining of membranes imaged are also depicted as total protein loading control.
J. Quantification of H3K27ac/H3K27me3 signals of the western blot in I. H3K27me3 was used as loading control. All values are depicted as mean values +/- SD.
Extended Data Fig. 10
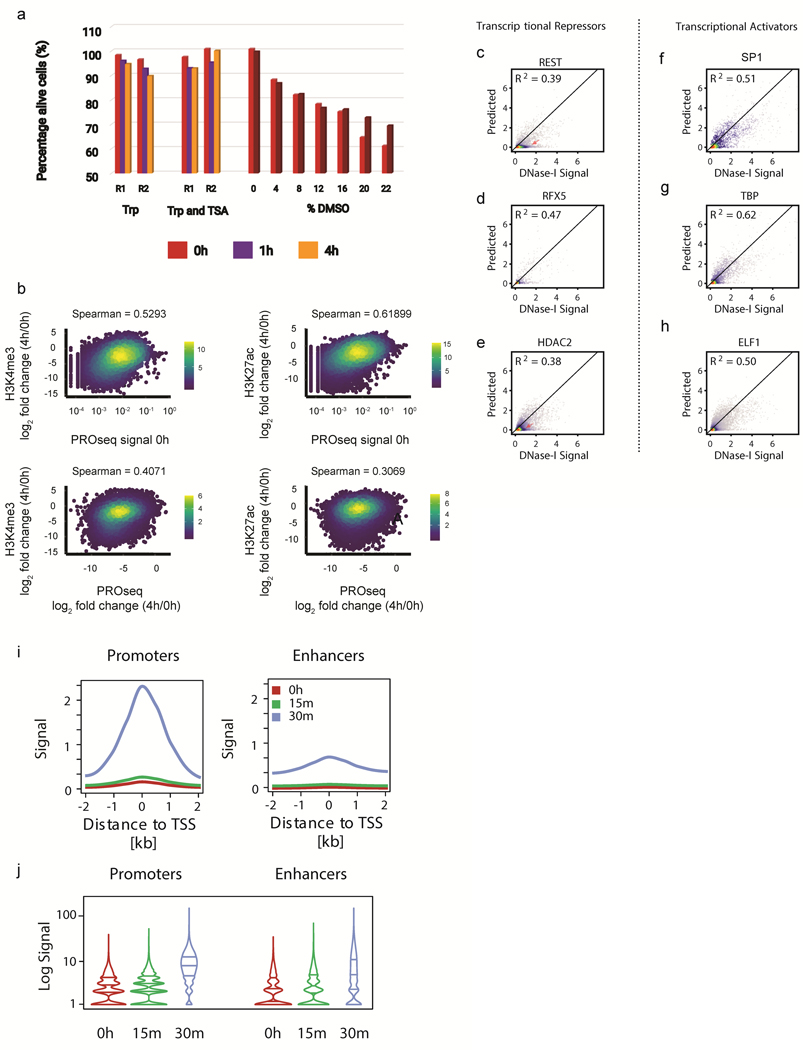
A. Bar plots display absorbance quantified at 590nm for AlmarBlue dye incubated with K562 cells during Triptolide, or Triptolide and Trichostatin A treatments. Two technical replicates were averaged for each time point. R1 and R2 define separate biological replication of the experiment.
B. Scatter plots display the loss in H3K4me3 (left) and H3K27ac (right) as a function of Pol II transcription (top) or change in transcription (bottom). Changes in histone marks and transcription were calculated as log2 fold changes between 4h of Triptolide treatment and untreated cells. Plots show spearman rho correlations between conditions.
(C-H) Scatterplots show experimental DNase-I hypersensitivity (x-axis) as a function of predicted DNase-I hypersensitivity (yaxis) in 100 bp windows intersected with transcriptional repressors (C-E) or transcriptional activators (F-H).
(I-J) Meta (I) and Violin (J) plots display TBP CUT&RUN signal at gene promoters and enhancers in a short 30min
Triptolide time course.
Supplementary Material
TPR File
Supplementary Notes 1-7
Supplementary Tables 1-3
Acknowledgements
We thank XSEDE allocation number TG-MCB160061 as well as an NVIDIA GPU Grant for providing computational resources required in this study. We thank James Lewis, Haiyuan Yu, Anniina Vihervaara, Mike DeBerardine, and all members of the Danko and Lis laboratories for valuable discussions and suggestions. Work in this publication was supported by R01-HG009309 (NHGRI) to C.G.D. and a grant from the Zweig Memorial Fund for Equine Research to D.F.A. and C.G.D., and by NIH grant RM1GM139738 to J.T.L.. D.F.A. is an Investigator of the Dorothy Russell Havemeyer Foundations, Inc. The content is solely the responsibility of the authors and does not necessarily represent the official views of the US National Institutes of Health. Some of the figures in this manuscript were created using BioRender.
Footnotes
Competing Interests Statement
The authors declare no competing interests.
References
Full text links
Read article at publisher's site: https://doi.org/10.1038/s41588-022-01026-x
Read article for free, from open access legal sources, via Unpaywall:
https://www.ncbi.nlm.nih.gov/pmc/articles/PMC9444190
Citations & impact
Impact metrics
Citations of article over time
Alternative metrics

Discover the attention surrounding your research
https://www.altmetric.com/details/124421088
Smart citations by scite.ai
Explore citation contexts and check if this article has been
supported or disputed.
https://scite.ai/reports/10.1038/s41588-022-01026-x
Article citations
ZIC2 and ZIC3 promote SWI/SNF recruitment to safeguard progression towards human primed pluripotency.
Nat Commun, 15(1):8539, 02 Oct 2024
Cited by: 0 articles | PMID: 39358345 | PMCID: PMC11447223
DFF-ChIP: a method to detect and quantify complex interactions between RNA polymerase II, transcription factors, and chromatin.
Nucleic Acids Res, 52(18):e88, 01 Oct 2024
Cited by: 0 articles | PMID: 39248105 | PMCID: PMC11472042
dHICA: a deep transformer-based model enables accurate histone imputation from chromatin accessibility.
Brief Bioinform, 25(6):bbae459, 01 Sep 2024
Cited by: 0 articles | PMID: 39316943 | PMCID: PMC11421843
The Wild West of spike-in normalization.
Nat Biotechnol, 42(9):1343-1349, 01 Sep 2024
Cited by: 0 articles | PMID: 39271835
Functional Roles of H3K4 Methylation in Transcriptional Regulation.
Mol Cell Biol, 44(11):505-515, 18 Aug 2024
Cited by: 0 articles | PMID: 39155435
Review
Go to all (44) article citations
Data
Data behind the article
This data has been text mined from the article, or deposited into data resources.
GEO - Gene Expression Omnibus
- (1 citation) GEO - GSE163043
IGSR: The International Genome Sample Resource
- (2 citations) IGSR/1000 Genomes - GM12878
Similar Articles
To arrive at the top five similar articles we use a word-weighted algorithm to compare words from the Title and Abstract of each citation.
Histone modifications form a cell-type-specific chromosomal bar code that persists through the cell cycle.
Sci Rep, 11(1):3009, 04 Feb 2021
Cited by: 8 articles | PMID: 33542322 | PMCID: PMC7862352
When histones are under glucose starvation.
J Biosci, 45:17, 01 Jan 2020
Cited by: 2 articles | PMID: 31965995
Review
NUCLIZE for quantifying epigenome: generating histone modification data at single-nucleosome resolution using genuine nucleosome positions.
BMC Genomics, 20(1):541, 02 Jul 2019
Cited by: 1 article | PMID: 31266464 | PMCID: PMC6604165
Oxoglutarate dehydrogenase and acetyl-CoA acyltransferase 2 selectively associate with H2A.Z-occupied promoters and are required for histone modifications.
Biochim Biophys Acta Gene Regul Mech, 1862(10):194436, 01 Oct 2019
Cited by: 12 articles | PMID: 31682939 | PMCID: PMC7187930
Funding
Funders who supported this work.
NHGRI NIH HHS (1)
Grant ID: R01 HG009309
NIGMS NIH HHS (2)
Grant ID: T32 GM007273
Grant ID: RM1 GM139738
U.S. Department of Health & Human Services | NIH | National Human Genome Research Institute (1)
Grant ID: R01-HG009309
U.S. Department of Health & Human Services | NIH | National Institute of General Medical Sciences (1)
Grant ID: RO1GM25232


