Abstract
Free full text

NDST2 (N-Deacetylase/N-Sulfotransferase-2) Enzyme Regulates Heparan Sulfate Chain Length*♦
Abstract
Analysis of heparan sulfate synthesized by HEK 293 cells overexpressing murine NDST1 and/or NDST2 demonstrated that the amount of heparan sulfate was increased in NDST2- but not in NDST1-overexpressing cells. Altered transcript expression of genes encoding other biosynthetic enzymes or proteoglycan core proteins could not account for the observed changes. However, the role of NDST2 in regulating the amount of heparan sulfate synthesized was confirmed by analyzing heparan sulfate content in tissues isolated from Ndst2−/− mice, which contained reduced levels of the polysaccharide. Detailed disaccharide composition analysis showed no major structural difference between heparan sulfate from control and Ndst2−/− tissues, with the exception of heparan sulfate from spleen where the relative amount of trisulfated disaccharides was lowered in the absence of NDST2. In vivo transcript expression levels of the heparan sulfate-polymerizing enzymes Ext1 and Ext2 were also largely unaffected by NDST2 levels, pointing to a mode of regulation other than increased gene transcription. Size estimation of heparan sulfate polysaccharide chains indicated that increased chain lengths in NDST2-overexpressing cells alone could explain the increased heparan sulfate content. A model is discussed where NDST2-specific substrate modification stimulates elongation resulting in increased heparan sulfate chain length.
Introduction
Heparan sulfate (HS)4 proteoglycans are important constituents of the cell surface and extracellular matrix of both vertebrate and invertebrate cells. During embryonic development, the HS proteoglycans (HSPGs) act as coreceptors and participate in the generation and maintenance of morphogen gradients. Without HS, mouse embryos die before gastrulation takes place (1, 2). Also in the adult animal, HSPGs influence physiological as well as pathophysiological processes (3,–6).
Heparin is well known for its anticoagulant activity, exerted through the interaction of a pentasaccharide sequence with the protease inhibitor antithrombin (7). Although HS is synthesized by most animal cells, heparin is synthesized exclusively by connective tissue-type mast cells where the polysaccharide chains occur attached to the serglycin core protein (8). The two glycosaminoglycans have the same polysaccharide backbone, but they differ in their degree of modification, with heparin being more heavily sulfated than HS. Although anticoagulant activity is an important pharmacological function of heparin, the physiological role of heparin is probably to store and in some cases activate components of the mast cell granules such as histamine, mast cell-specific proteases, and other inflammatory mediators (9).
The HS and heparin sulfation patterns determine the ability of the glycosaminoglycans to interact with proteins and thereby affect biological processes. The patterns are created during biosynthesis, where sulfotransferases in the Golgi compartment add sulfate groups while the chains are being polymerized (10). The sulfation patterns may also be altered post-synthetically by specific sulfatases (11). During biosynthesis, the exostosin-1/exostosin-2 (EXT1/EXT2) HS copolymerases add N-acetylglucosamine (GlcNAc) and glucuronic acid (GlcUA) residues in alternating sequence to the growing chain, whereas glucosaminyl N-deacetylase/N-sulfotransferase (NDST) enzymes remove acetyl groups from GlcNAc residues and replace them with sulfate groups. Subsequent modifications, including epimerization of GlcUA into iduronic acid and O-sulfation at various positions, occur mainly in N-sulfated regions. Therefore, the NDST enzymes have a key role in designing the overall HS sulfation pattern.
There are four mammalian NDST genes. Although NDST1 and NDST2 transcripts are widely distributed, NDST3 and NDST4 are mostly expressed during embryonic development and in the adult brain (12, 13). Lack of NDST1 in mice results in perinatal lethality, wherein the newborn pups display respiratory failure, skeletal abnormalities, and brain and heart defects (14,–17). In contrast, Ndst2−/− mice are viable and fertile but contain abnormal connective tissue-type mast cells with a dramatic reduction in heparin sulfation (18, 19). Despite the ubiquitous expression of Ndst2, HS structure appears to be essentially unaltered in Ndst2−/− mice (20, 21). In contrast, HS structure is altered in every Ndst1−/− cell and Ndst1−/− mouse tissue examined (Ref. 20 and references therein). Thus, NDST1 appears to be the main NDST isoform responsible for N-sulfation of HS, whereas NDST2 is active in heparin biosynthesis in mast cells. The function of NDST2 in cells other than mast cells remains unknown. In this report, we demonstrate that NDST2, through its ability to increase HS chain length, can regulate HS content in cells and tissues.
Results
HEK 293 cells overexpressing murine versions of both NDST1 and NDST2 were generated by transfection of a cell line stably expressing His-tagged NDST2 with an Ndst1 cDNA construct. Several clones stably expressing the two NDST isoforms were picked and cultured as cell lines. Two of them were selected for analysis. Judging from Western blotting of cell extracts, NDST1/NDST2-transfected clone 3 expressed somewhat lower levels of both NDST1 and NDST2 compared with clone 2 (Fig. 1, A and B). Enzyme activities correlated with the Western blotting results (Fig. 1, C and D). The two NDST1/NDST2-overexpressing cell lines displayed higher enzyme activities than the parental NDST2-overexpressing cells, with clone 2 extracts containing the highest enzyme activities. NDST2 has previously been shown to have high N-deacetylase but weaker N-sulfotransferase activity (12), explaining the small difference in N-sulfotransferase activity between mock and NDST2-transfected cells, although the N-deacetylase activity is increased at least eight times in the NDST2-overexpressing cells.
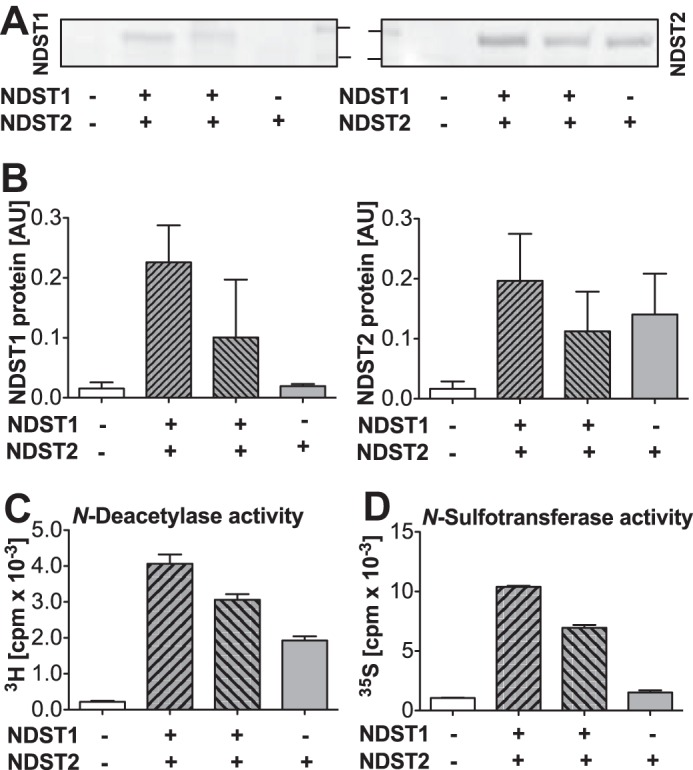
NDST expression and enzyme activities of stable HEK 293 cell lines overexpressing NDST2 or NDST2 together with NDST1. A and B, NDST1 and NDST2 protein expression was analyzed by SDS-PAGE and Western blotting after solubilization of cells in 1% Triton X-100-containing buffer. The separated proteins (from left to right obtained from mock-transfected HEK 293 cells, clone 2, clone 3, and parental cell line overexpressing NDST2) were blotted to a nitrocellulose membrane; NDST1 was detected with anti-NDST1 peptide antibody 1A and NDST2 with an antibody recognizing the cytoplasmic part of the enzyme. The two standard markers indicated have molecular masses of 100 and 75 kDa, respectively. The ratio of NDST and total protein expression, measured after staining with Ponceau Red, is shown below the blots (mean value ± S.E. of three separate runs). C, N-deacetylase activity, and D, N-sulfotransferase activity of the cell lines examined in A and B (mean values of two determinations ± S.E.). The enzyme measurements in C and D have been repeated with similar results. AU, arbitrary units.
More Total HS and Longer HS Chains in Cells Overexpressing NDST2
As shown previously (22, 23), overexpression of NDST2 in HEK 293 cells results in increased HS N-sulfation (Fig. 2A). However, additional expression of NDST1 in the NDST2-overexpressing cells did not increase total sulfation (Fig. 2A) despite the higher enzyme activities in extracts of these cells than in the parental NDST2-overexpressing cell line (Fig. 1, C and D). Most strikingly, the three NDST-overexpressing cells all synthesize ≈4 times the amount of HS found in untransfected cells (Fig. 2B). Gel chromatography of 35S-labeled HS chains isolated from proteoglycans recovered from cells cultured in the presence of [35S]sulfate showed that NDST1/NDST2-overexpressing cells produced longer chains than mock-transfected cells (Fig. 3A). However, the longest chains were found in cells overexpressing NDST2 alone (Fig. 3A). Although the HS chains are polydisperse and are eluted as broad peaks (Fig. 3A), a rough estimate of their apparent molecular weights was attempted. Interestingly, the increase in HS apparent molecular weight, comparing HS chains from the mock-transfected cells (apparent mass ≈35 kDa) with those from the NDST2-overexpressing cells (apparent mass ≈160 kDa), was in the same order of magnitude as the increase in HS content (Fig. 2B, ≈4-fold). The ability of NDST2 to affect HS chain length was confirmed in HeLa cells; HS chains isolated from HeLa cells stably expressing NDST2 were longer than those produced in untransfected cells, even though the increase was less pronounced in these cells (Fig. 3B).
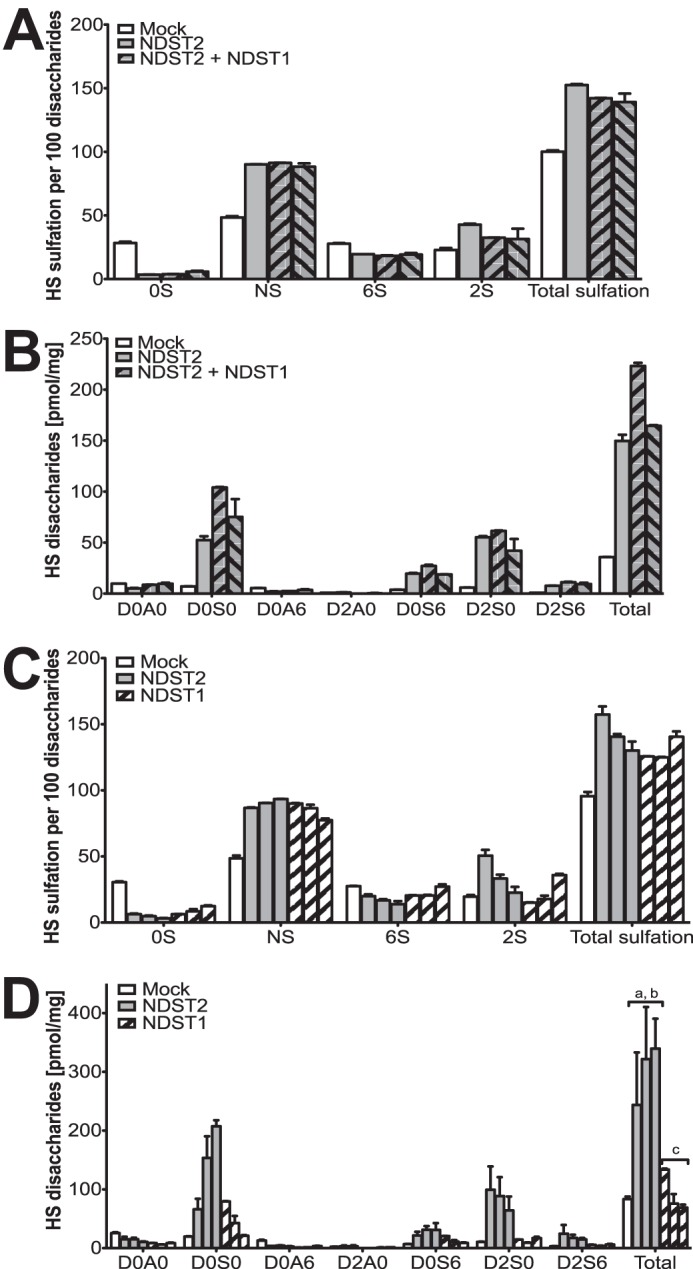
Amounts and composition of HS produced by HEK 293 cell lines overexpressing NDSTs. A and B, HS disaccharides obtained from the cell lines characterized in Fig. 1 were analyzed by RPIP-HPLC. The samples analyzed are HS isolated from mock-transfected HEK 293 cells (white bars), the parental cell line overexpressing NDST2 (gray bars), and clone 2 and clone 3 overexpressing both NDST1 and NDST2 (gray bars with black stripes). The values shown are the mean of two determinations ± S.E. A, percentage of unsulfated disaccharides (0S), N-sulfated disaccharides (NS), 6-O-sulfated disaccharides (6S), and 2-O-sulfated disaccharides (2S). Total sulfation is the sum of N-sulfate, 2-O-sulfate, and 6-O-sulfate groups in 100 disaccharides. B, absolute amounts, calculated per mg of dry weight, of different disaccharide species recovered from the cell lines in A. D0A0, HexAGlcNAc; D0S0, HexAGlcNS; D0A6, HexAGlcNAc(6S); D2A0, HexA(2S)GlcNAc; D0S6, HexAGlcNS(6S); D2S0, HexA(2S)GlcNS; D26S, HexA(2S)GlcNS(6S); Total is sum of all disaccharides. See Ref. 45 for more information of the structural code. C and D, HS disaccharides obtained from cell lines overexpressing either NDST2 or NDST1 were analyzed by RPIP-HPLC. The samples analyzed are from left to right HS isolated from: mock-transfected (pBud CE4.1 plasmid) HEK 293 cells; two NDST2-transfected HEK 293 cells (clones S2 and S5, see (22)); HEK 293 cells transfected with His-tagged NDST2 (34); and three different cell-lines transfected with His-tagged NDST1 (34). C, percentage of unsulfated disaccharides (0S), N-sulfated disaccharides (NS), 6-O-sulfated disaccharides (6S), and 2-O-sulfated disaccharides (2S) in HS from mock-transfected cells and from cells transfected with NDST2 or NDST1, respectively. Total sulfation is the sum of N-sulfate, 2-O-sulfate, and 6-O-sulfate groups in 100 disaccharides. D, absolute amounts, calculated per mg of dry weight, of the different disaccharide species recovered from the cell lines in C. a, p < 0.05 compared with mock; b, p < 0.05 compared with NDST1; and c, p < 0.05 compared with NDST2 (calculated with one-way analysis of variance).
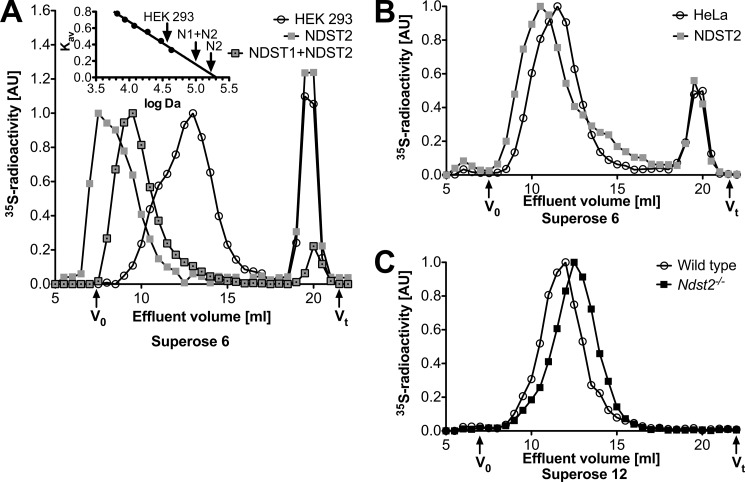
HS chain length in cells overexpressing or lacking NDST2. A, [35S]sulfate-labeled HS from mock-transfected cells (circles), cells overexpressing NDST2 (squares), and cells overexpressing both NDST2 and NDST1 (framed squares) were isolated from intact proteoglycans as described under “Experimental Procedures.” The size distribution was analyzed by gel chromatography on a Superose 6 column in 1% Triton X-100, 1 m NaCl, 50 mm Tris-HCl, pH 7.5. Fractions of 0.5 ml were collected and analyzed by scintillation counting. The inset is a plot of Kav values obtained for saccharide standards of known apparent Mr against log Mr. The three arrows correspond to Kav values used to estimate the apparent Mr of the [35S]sulfate-labeled HS samples. The experiment has been repeated with similar results. B, [35S]sulfate-labeled HS from control HeLa cells (circles) or HeLa cells overexpressing NDST2 (squares). Results shown are mean values of two experiments. C, [35S]sulfate-labeled HS from peritoneal cell-derived mast cells isolated from wild type (circles) and Ndst2−/− mice (filled squares). Results shown are mean values of two (wild type) or three (Ndst2−/−) experiments. The samples analyzed contained between 3 × 10³ and 6 × 10³ cpm, and values were normalized to arbitrary units (AU) where the highest value (cpm/fraction) of each run was set at 1.
To study whether NDST1 contributed to the increased quantities of HS synthesized, we compared the amounts of HS recovered from three different cell lines overexpressing only NDST1 with three cell lines overexpressing NDST2 alone (Fig. 2D). The results clearly show that the amounts of HS synthesized were influenced by NDST2 but not by NDST1 overexpression. Again, the different NDST2-overexpressing cell lines contained approximately four times more HS than control (or NDST1-overexpressing cells).
Expression of HS Biosynthesis Enzymes and Proteoglycan Core Proteins
To investigate whether overexpression of a murine Ndst2 construct influenced the endogenous gene transcript abundances of other glycosaminoglycan biosynthetic genes, the relative transcript abundance of genes important for the formation of the linkage region and elongation of HS chains as well as modification enzymes were assessed using qPCR (Fig. 4, A and B). As shown in Fig. 4, Ndst2 overexpression does not seem to influence the endogenous glycosaminoglycan biosynthetic gene expression. Because the primers used are specific for cDNA corresponding to human transcripts, they do not recognize the transfected constructs. The transcript abundance of genes encoding HS proteoglycan core proteins was also determined (Fig. 4C). Similar to the glycosaminoglycan biosynthetic genes, no major alteration in gene expression of core protein genes was apparent. Thus, it appears unlikely that the increased amount of HS synthesized in NDST2-overexpressing cells is an indirect effect of altered expression of genes important for HS production.
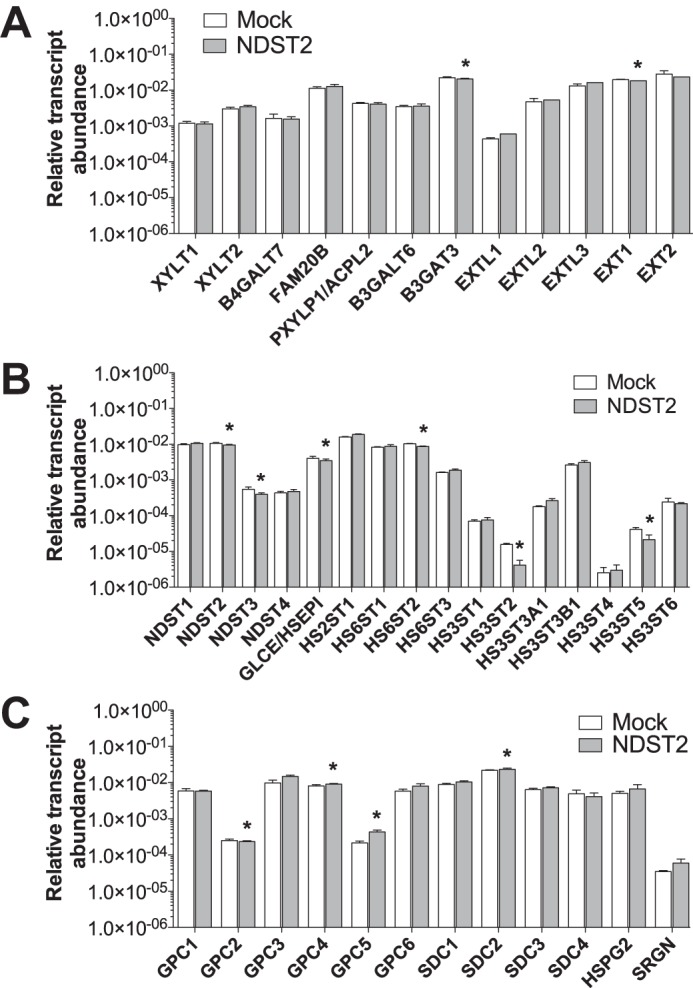
Endogenous HEK 293 transcript levels of HS biosynthetic enzymes and proteoglycan core proteins. Relative transcript abundance levels of enzymes involved in the biosynthesis of the linkage tetrasaccharide and in elongation of the HS chain (A), modification enzymes (B), and HS proteoglycan core proteins in non-transfected cells and cells overexpressing NDST2 (C). The results were obtained by qPCR. Values shown are the results from triplicate experiments and were normalized to the expression of RPL4, as described previously (31). Asterisks denote significant differences (p < 0.05) in expression calculated using two-tailed Student's t test.
Decreased HS Levels in Ndst2 Knock-out Mice
If increased levels of NDST2 result in enhanced production of HS, Ndst2 knock-out mice would be expected to synthesize less HS. RPIP-HPLC analyses of tissues isolated from wild type and Ndst2−/− adult mice indeed showed that this was the case (Fig. 5). In several tissues the total amount of HS recovered was about half that found in wild type tissues. In ears, which are rich in connective tissue-type mast cells synthesizing heparin, the reduction in heparin/HS amounts was even greater, whereas in heart, muscle, and in particular in brain, the reduction in HS amounts was less pronounced. Interestingly, the Ndst2 mRNA expression level, previously determined for different tissues by Northern blotting (13), correlates well with the extent of reduction in HS amounts in the same tissues lacking Ndst2. HS isolated from liver and kidney of E18.5 embryos were also analyzed with similar results (Fig. 5). As predicted, HS/heparin chains isolated from Ndst2−/− peritoneal cell-derived mast cells were shorter than those obtained from control cells (Fig. 3C).
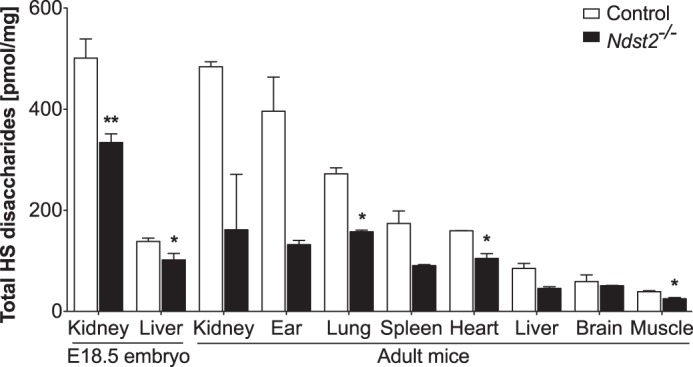
Decreased levels of HS in tissues from Ndst2−/− embryos and mice. HS disaccharides obtained after heparinase digestion of HS purified from tissues of control and Ndst2−/− adult mice and E18.5 embryos were analyzed by RPIP-HPLC, and the total amount of disaccharides per mg dry weight was determined. Two adult animals and four embryos of each genotype were analyzed. Asterisks denote significant differences (*, p < 0.05; **, p < 0.001) in amounts calculated using two-tailed Student's t test.
We have previously shown that lack of NDST2 does not result in alteration of the HS N-sulfation pattern (20, 21) but is essential for heparin sulfation (18). However, no detailed compositional analyses have previously been reported. Judging from Table 1, there are only minor differences in disaccharide composition when the same tissues from wild type and knock-out animals are compared. The spleen, rich in myeloid cells, is an exception, where the amount of trisulfated disaccharides (D2S6) is particularly reduced in Ndst2−/− HS. The disaccharide composition of ear HS/heparin is also altered, with the relative level of trisulfated disaccharides in knock-out tissue only amounting to one-third of the wild type level (Table 1). Again, the heparin content of this tissue may be the reason for the significant reduction of sulfation in the absence of NDST2. Transcript analysis of Ext1 and Ext2 expression in kidney and ear tissue in Ndst2−/− mice showed that transcript abundance was not influenced by the absence of NDST2 (Fig. 6).
TABLE 1
HS disaccharides obtained from different mouse tissues by exhaustive heparin lyase cleavage
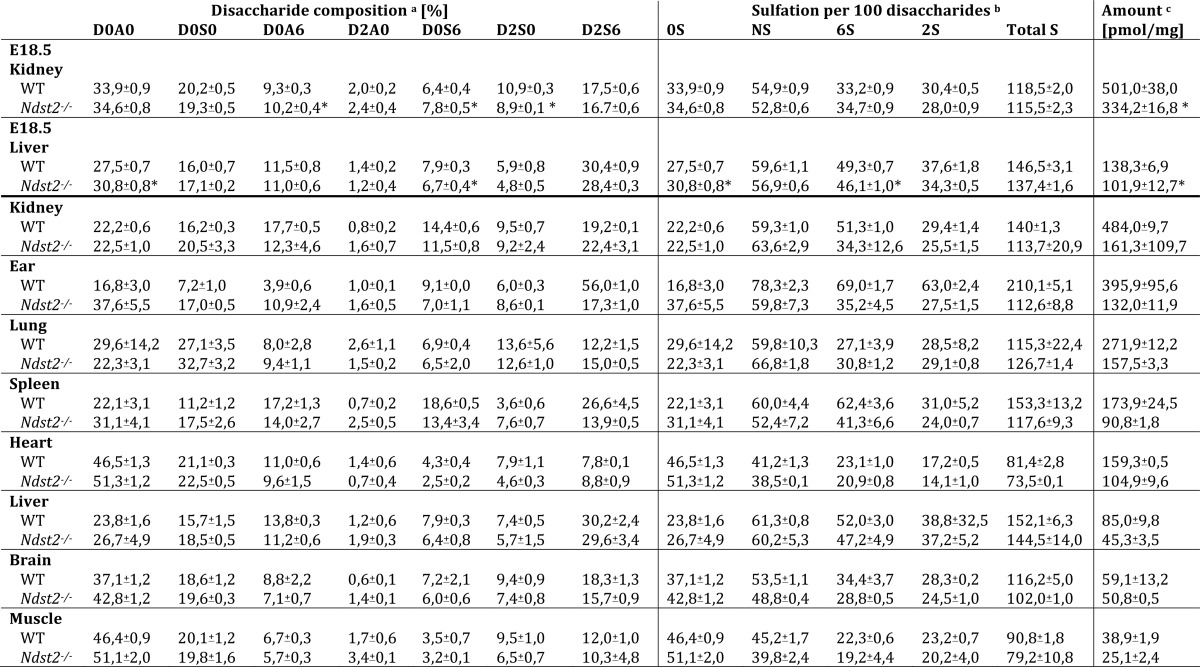
a Disaccharides were generated by digestion with a heparin lyase mixture and analyzed by RPIP-HPLC as described under “Experimental Procedures”. The abbreviations used in figures and text are based on the disaccharide structural code (45) and refer to the following structures: D0A0, ΔHexA-GlcNAc; D0S0, ΔHexA-GlcNS; D0A6, ΔHexA-GlcNAc6S; D2A0, ΔHexA2S-GlcNAc; D0S6, ΔHexA-GlcNS6S; D2S0, ΔHexA2S-GlcNS; D2S6, ΔHexA2S-GlcNS6S. Values are given in mol % of total disaccharides and are the mean ±S.E. of four (E18.5 tissues) and two samples (tissues from adult mice).
b The degree and type of sulfation are calculated from disaccharides composition.
c Total amounts are given as picomoles/mg of dry weight starting material as calculated from peak areas relative to known amounts of standard disaccharides. * indicates significant changes in the E18.5 samples.
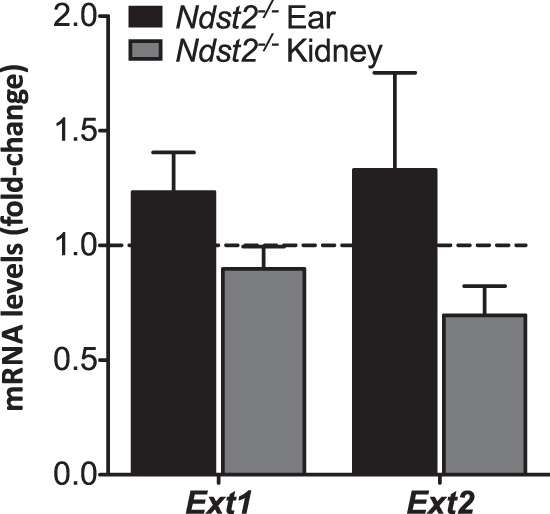
No difference in Ext1 or Ext2 transcript levels as a result of Ndst2 knock-out. Transcript levels in knock-out tissues relative to their corresponding controls are shown. The difference in mRNA expression was calculated as fold-change (ΔΔCt method) using β-actin as reference gene. Values are the mean of three (kidney), and four (ear) samples, respectively, except for Ext2 expression where eight ear samples were analyzed. Two-tailed Student's t test analysis of the data did not show any significant difference between control and knock-out samples.
Discussion
The essential role of NDST2 in heparin biosynthesis in connective tissue-type mast cells is well established (8), although the effect of NDST2 on HS sulfation is less apparent. HNO2 treatment at pH 1.5 (which cleaves at N-sulfated glucosamine residues) results in the generation of identical fragments when HS from the same tissues of control and Ndst2−/− mouse tissues are compared (20). However, an NDST2-deficient background has also been shown to amplify the phenotype of tissue/cell-specific conditional Ndst1 knock-outs (Ref. 14 and references therein).
In the cell lines used in this study, both N-deacetylase and N-sulfotransferase activities were increased after stable transfection of Ndst1 in cells overexpressing NDST2 (Fig. 1). The contribution of NDST1 to N-sulfotransferase activity was greater than that to N-deacetylase activity, consistent with previous results (12). However, the increased NDST enzyme activities did not alter the degree of N-sulfation, and total sulfation was instead slightly reduced in the cells overexpressing both NDST1 and NDST2, apparently caused by a reduction in 2-O-sulfation (Fig. 2, A and B). These results clearly demonstrate that the two NDST isoforms are not entirely exchangeable, also supported by previous studies (20). For instance, whereas lowered sulfation is seen in HS from Ndst1−/− E18.5 embryonic mouse liver, which contains ~40% of N-deacetylase activity found in control mouse liver, HS structure is unaltered in Ndst2−/−/Ndst1+/− liver despite a lower N-deacetylase activity (less than 30% of control mouse liver (20)).
The increased chain length in cells overexpressing NDST2 (Fig. 3A) may suggest that the rate of synthesis is increased in the presence of this isoform or that the time spent on elongation/modification is prolonged. Earlier work characterizing heparin synthesis in a microsomal fraction from mouse mastocytoma demonstrated that an N-sulfate group on the penultimate glucosamine unit stimulated transfer of GlcUA to the growing chain (24). This result indicated that polymerization and N-sulfation are closely linked during biosynthesis. The extended heparin chains synthesized by connective tissue-type mast cells (25), with a high NDST2/NDST1 ratio (13), support the notion that NDST2 may influence HS content by increasing the polysaccharide chain length. The rough estimation of the HS polysaccharide chain length (Fig. 3A) indicated that the HS chain length had increased with a factor four in the NDST2-overexpressing cells, similar to the increase in total HS content (Fig. 2). Because HS chain length and structure may differ between different HS proteoglycans, as shown for glypican-5 and -3 in rhabdomyosarcoma cells (26), an explanation to the increased chain lengths could be altered core protein expression as a result of NDST2 overexpression. However, the qPCR results obtained (Fig. 4) do not support this conclusion because only minor differences in mRNA abundance in mock-transfected and NDST2-transfected cells were seen. Instead, our results tentatively suggest that the elevated amounts of HS in the NDST2-overexpressing HEK 293 cells could be solely explained by the increased NDST2 enzyme activity, stimulating polysaccharide chain polymerization.
The high sulfation degree of heparin where more than 80% of the glucosamine residues are N-sulfated has previously also been attributed to the high level of NDST2 expressed by mast cells. Interestingly, Ndst1−/− and Ndst1+/− mast cells synthesize heparin with a higher sulfate content than control mast cells (27), suggesting that NDST1 and NDST2 in the wild type cells may compete for incorporation into tentative biosynthesis enzyme complexes responsible for biosynthesis (28). In the absence of NDST1, with a lower capacity than NDST2 to synthesize extended N-sulfated domains, the NDST2-containing enzyme complexes are more efficient resulting in oversulfated heparin. A competition between NDST1 and NDST2 for incorporation into functional enzyme complexes could also explain why the chain length of HS produced in HEK 293 cells, overexpressing both NDST1 and NDST2, was reduced compared with the cells overexpressing only NDST2 (Fig. 3A). Interestingly, work by Liu and co-workers (29) has indicated that sulfation performed by NDST1 occurs from the non-reducing toward the reducing end, opposite to the direction of polymerization. Perhaps, NDST2 works in the same direction as the HS polymerases EXT1 and EXT2, explaining why this isoform but not NDST1 (Fig. 4) affects the function of the polymerases. Because neither the lack of NDST2 in mouse tissues nor overexpression of the enzyme in HEK 293 cells had a large impact on EXT1 or EXT2 mRNA expression (Fig. 6), we speculate that stimulation of polymerization may occur largely through NDST2-mediated sulfation of the growing chain making it a better substrate for the polymerases. In addition to an essential role of NDST2 in heparin biosynthesis, the main function of NDST2 may thus be to control the amount of HS present in the tissues by affecting the chain length. Because HS function depends on interactions with proteins (30), altered concentration and chain length as well as altered structure of HS will affect the level of HS-protein complexes. In particular during embryonic development, when the co-receptor function of HSPGs is essential and when the proteoglycans are important for generation and maintenance of morphogen gradients, the lowered amount of HS may be critical. This may explain why lack of both NDST1 and NDST2 results in early embryonic lethality (31), although most Ndst1−/− embryos survive until birth (14), and why the ability of embryonic stem cells deficient in both NDST1 and NDST2 to differentiate is limited (27, 32, 33).
Experimental Procedures
Mice
Mice deficient in NDST2 (N10 on C57BL/6) were generated as described previously (18). Control mice were of the C57BL/6 strain. The animal experiments were approved by the local animal ethics committee in Uppsala, Sweden. For timed pregnancies, noon of the day when a vaginal plug was observed was considered to be embryonic day (E) 0.5.
Cells
HEK 293 cells with a stable overexpression of murine His6-tagged NDST2 and His6-tagged NDST1, respectively, and HEK 293 cells expressing NDST2 without His6 tag have previously been described (22, 34). To generate NDST1/NDST2-overexpressing cells, NDST2 (His6 tag)-overexpressing cells were transfected with an Ndst1/pBud CE4.1 plasmid construct using LipofectamineTM 2000 (Invitrogen) according to the manufacturer's protocol. Stable clones were selected at a high concentration of Zeocin (0.4 mg/ml) in Dulbecco's modified Eagle's medium Glutamax complemented with 10% fetal calf serum (Invitrogen), 1% penicillin/streptomycin (Invitrogen), and 0.2 mg/ml G418 (Invitrogen). The G418 was present to keep the selection for NDST2 (His6 tag), previously transfected in a pcDNA3 construct. All NDST-overexpressing cells and mock-transfected control cells were maintained in the same medium containing 0.2 mg/ml G418 (pCDNA3 constructs) and 0.2 mg/ml Zeocin + 0.2 mg/ml G418 (pcDNA3 + pBud constructs).
HeLa cells were transfected with the previously described Ndst2/pcDNA3 construct (34) using LipofectamineTM 2000 LTX (Invitrogen) according to the manufacturer's protocol. After selection with 0.5 mg/ml G418, single colonies were picked and used to establish NDST2-overexpressing HeLa cell lines. Peritoneal cell-derived mast cells isolated from control and Ndst2−/− mice were cultured as described previously (35).
Solubilization of Cells for Western Blotting and Enzyme Activity Measurements
Trypsinized cells from a T75 flask were incubated for 30 min on ice in 0.6 ml of solubilization buffer: 1% Triton X-100, 50 mm Tris-HCl, pH 7.4, 2 mm EDTA, and 1× complete protease inhibitor mixture, EDTA-free (Roche Applied Science). After centrifugation for 10 min at 10,000 × g, the supernatant was saved for analysis. Protein concentration was determined using the Bradford assay (Bio-Rad).
SDS-PAGE and Western Blotting
Cell lysates corresponding to 60 μg of protein were run on pre-cast 4–15% mini-PROTEAN SDS-polyacrylamide gels (Bio-Rad) followed by blotting to nitrocellulose membranes. After transfer, the membranes were stained with Ponceau Red (0.5% in 1% acetic acid) for 5 min followed by washing in H2O (two times for 2 min). Pictures of Ponceau-stained membranes were taken using a ChemiDocTM MP system (Bio-Rad). After blocking overnight in TBS/Tween (20 mm Tris-HCl, pH 7.6, 150 mm NaCl, 0.1% Tween 20) containing 5% nonfat dry milk, the membranes were incubated at room temperature with primary rabbit antibodies diluted in blocking buffer. The NDST2 antiserum (20) was diluted 1:600, and the affinity-purified NDST1 antibody (36) was used at a concentration of 2 μg/ml. After the membranes had been washed in TBS/Tween buffer (20 mm Tris-HCl, 150 mm NaCl, and 0.1% Tween 20, pH 7.6), they were incubated with secondary goat anti-rabbit horseradish peroxidase antibodies (1:10,000), in TBS/Tween/milk buffer for 1 h with shaking at room temperature. The membranes were then extensively washed, and the peroxidase activity of the membrane-bound antibodies was detected using the Amersham Biosciences ECL Plus Western blotting detection reagents (GE Healthcare) captured with the ChemiDocTM MP System. The ratio of NDST and protein expression was calculated after quantification of band intensities using ImageJ (version 1.45s, rsbweb.nih.gov).
NDST Enzyme Assays
N-Deacetylase and N-sulfotransferase activities were analyzed as described (37). Briefly, N-deacetylase activity was measured by incubating solubilized cells (80 μg of protein) and 10,000 cpm of N-[3H]acetyl-labeled K5 capsular polysaccharide for 30 min at 37 °C in 0.2 ml of incubation buffer, containing 50 mm Mes, pH 6.3, 10 mm MnCl2, and 1% Triton X-100. The released [3H]acetate was detected in a biphasic scintillation counting system.
N-Sulfotransferase activity was analyzed by measuring incorporation of 35S from the sulfate donor [35S]PAPS into N-deacetylated Escherichia coli capsular K5 polysaccharide as a substrate. Solubilized cells (80 μg of protein) were incubated with substrate and 2 μCi of [35S]PAPS in 50 mm Hepes, pH 7.4, 10 mm MgCl2, 10 mm MnCl2, 5 mm CaCl2, 3.5 μm NaF, and 1% Triton X-100 in 0.1 ml for 30 min at 37 °C. The polysaccharide was precipitated with ethanol for 4 h, separated from excess [35S]PAPS by Sephadex G-25 superfine (GE Healthcare) gel filtration, and quantified by scintillation counting.
Disaccharide Analysis
Glycosaminoglycans were isolated from cells or murine tissues as described previously (Ledin et al. (21) and Dagälv et al. (27)). Chondroitin sulfate and HS disaccharides generated after digestion with chondroitinase ABC and heparinase I, II, and III, respectively, were subjected to RPIP-HPLC analysis followed by post-column derivatization with cyanoacetamide and detection in a fluorescence detector (21).
Metabolic Labeling
Mock-transfected HEK 293 cells, HeLa cells, cells overexpressing murine NDST2 alone or together with NDST1, and peritoneal cell-derived mast cells from Ndst2−/− or control mice were incubated with 50 μCi/ml [35S]sulfate in the cell culture medium described above. After 20 h, 35S-labeled proteoglycans were purified from cell extracts by DEAE ion-exchange chromatography and gel chromatography on Superose 6 columns as described previously (38). After alkali treatment, the released glycosaminoglycan chains were incubated with chondroitinase ABC and saved for analysis (HEK 293 and HeLa cells) or subjected to gel chromatography on Sephadex G-50 to remove 35S-labeled CS degradation products (38) prior to analysis (peritoneal cell-derived mast cells).
Gel Chromatography of 35S-Labeled HS Chains
Size distribution of [35S]sulfate-labeled HS was analyzed by gel chromatography on Superose 6 or 12 columns in 1% Triton X-100, 1 m NaCl, 50 mm Tris-HCl, pH 7.5. Fractions of 0.5 ml were collected and analyzed by scintillation counting. Elution positions of saccharide standards of known molecular size (39) were used to generate a linear plot of Kav/log Mr values needed for calculation of apparent molecular weights of the 35S-labeled HS chains.
RNA Isolation and qPCR Analysis
For HEK 293 cells, mock-transfected or HEK 293 cells overexpressing murine NDST2 or NDST1 were harvested, flash-frozen in liquid nitrogen, and stored at −80 °C until use. RNA isolation and cDNA synthesis were carried out as described previously (40). The qRT-PCRs were performed in triplicate for each gene analyzed. Cycling conditions and analysis of amplimer products were performed as described previously (41). Primers for the control gene, RPL4, were included to normalize individual gene expression. Human-specific primer pairs for GAG-related genes were designed within a single exon (41), and primer design was validated previously using the standard curve method (41, 42). Calculation of relative transcript abundance and statistical analysis were done as described previously (43). For mouse tissues, kidneys from adult Ndst2−/− mice and wild type mice of similar ages were homogenized in TRIzol (Life Technologies, Inc.), and RNA was isolated according to the manufacturer's instructions. Ears from adult Ndst2−/− mice and wild type mice of similar ages were homogenized in lysis buffer from E.Z.N.A. Total RNA kit (Omega Bio-tek) and RNA were isolated according to the manufacturer's protocol. Mouse ears were homogenized using 2.0 mm beads (Zirkonia) on a bead beater. cDNA from 500 ng of all samples was generated using iScript cDNA synthesis kit (Bio-Rad), and qPCR analysis was performed with the help of KAPA SYBR Fast qPCR kit (KAPA Biosystems). Primers for β-actin were previously published (44), whereas primers for mouse Ext1 and mouse Ext2 were as follows: Ext1 forward, 5′-GGAGTTGCCATTCTCCGA-3′, and Ext1 reverse, 5′-TAAGCCTCCCACAAGAACTG-3′; Ext2 forward, 5′-AGTGTTAGTCTTGGACAAATGC-3′, and Ext2 reverse, 5′-GCCAGCCTGTAGGACATC-3′. All samples were analyzed in triplicate, and data are shown as fold-change of Ext1 and Ext2 expression in Ndst2−/− mice normalized to β-actin expression and to expression in wild type animals.
Author Contributions
A. Deligny and L. K. conceived and coordinated the study together with C. L. R. M. A. Deligny constructed the plasmids, generated and characterized the cell lines overexpressing NDST1 together with NDST2, and together with I. E. analyzed disaccharide composition and chain length of heparan sulfate in cells and tissues. T. D., A. Dagälv, and A. L. all contributed to the results presented in Figs. 5 and and6.6. A. V. N. and K. W. M. performed the expression analyses shown in Fig. 4. T. D. and A. Deligny prepared the figures and together with L. K. wrote the manuscript. All authors analyzed the results and approved the final version of the manuscript.
*This work was supported by grants from the Swedish Research Council (to L. K.), the Swedish Cancer Society (to L. K.), Stiftelsen för Proteoglykanforskning (to L. K.), and DAAD, German Academic Exchange Service (to T. D.), an International Academic Fellowship from the Leverhulme Trust (to C. L. R. M.), and National Institutes of Health Grant GM103490 (to K. M.). The authors declare that they have no conflicts of interest with the contents of this article. The content is solely the responsibility of the authors and does not necessarily represent the official views of the National Institutes of Health.
♦This article was selected as a Paper of the Week.
4The abbreviations used are:
- HS
- heparan sulfate
- HSPG
- heparan sulfate proteoglycan
- GlcUA
- glucuronic acid
- NDST
- N-deacetylase/N-sulfotransferase
- RPIP
- reversed-phase ion pairing
- PAPS
- adenosine 3′-phosphate,5′-phosphosulfate
- qPCR
- quantitative PCR.
References
Articles from The Journal of Biological Chemistry are provided here courtesy of American Society for Biochemistry and Molecular Biology
Full text links
Read article at publisher's site: https://doi.org/10.1074/jbc.m116.744433
Read article for free, from open access legal sources, via Unpaywall:
http://www.jbc.org/content/291/36/18600.full.pdf
Citations & impact
Impact metrics
Citations of article over time
Alternative metrics
Smart citations by scite.ai
Explore citation contexts and check if this article has been
supported or disputed.
https://scite.ai/reports/10.1074/jbc.m116.744433
Article citations
Incomplete Thermal Ablation-Induced FOXP4-Mediated Promotion of Malignant Progression in Liver Cancer via NDST2.
J Hepatocell Carcinoma, 11:1945-1959, 14 Oct 2024
Cited by: 0 articles | PMID: 39429915 | PMCID: PMC11488511
Genetic Variance in Heparan Sulfation Is Associated With Salt Sensitivity.
Hypertension, 81(10):2101-2112, 09 Sep 2024
Cited by: 0 articles | PMID: 39247955 | PMCID: PMC11404764
Differential regulation of heparan sulfate biosynthesis in fibroblasts cocultured with normal vs. cancerous prostate cells.
Front Immunol, 15:1440623, 09 Sep 2024
Cited by: 0 articles | PMID: 39318629 | PMCID: PMC11420852
Syndecans, Exostosins and Sulfotransferases as Potential Synovial Inflammation Moderators in Patients with Hip Osteoarthritis.
Int J Mol Sci, 25(8):4557, 22 Apr 2024
Cited by: 1 article | PMID: 38674142 | PMCID: PMC11049902
In vivo activities of heparan sulfate differentially modified by NDSTs during development.
Proteoglycan Res, 2(1):e17, 01 Jan 2024
Cited by: 1 article | PMID: 38616954 | PMCID: PMC11011245
Go to all (21) article citations
Data
Similar Articles
To arrive at the top five similar articles we use a word-weighted algorithm to compare words from the Title and Abstract of each citation.
Enzymatically active N-deacetylase/N-sulfotransferase-2 is present in liver but does not contribute to heparan sulfate N-sulfation.
J Biol Chem, 281(47):35727-35734, 19 Sep 2006
Cited by: 28 articles | PMID: 16984905
Lowered expression of heparan sulfate/heparin biosynthesis enzyme N-deacetylase/n-sulfotransferase 1 results in increased sulfation of mast cell heparin.
J Biol Chem, 286(52):44433-44440, 02 Nov 2011
Cited by: 26 articles | PMID: 22049073 | PMCID: PMC3248000
Molecular cloning and expression of a third member of the heparan sulfate/heparin GlcNAc N-deacetylase/ N-sulfotransferase family.
J Biol Chem, 274(5):2690-2695, 01 Jan 1999
Cited by: 73 articles | PMID: 9915799
Heparan sulfate and development: differential roles of the N-acetylglucosamine N-deacetylase/N-sulfotransferase isozymes.
Biochim Biophys Acta, 1573(3):209-215, 01 Dec 2002
Cited by: 91 articles | PMID: 12417402
Review
Funding
Funders who supported this work.
Biotechnology and Biological Sciences Research Council (1)
Grant ID: 978724
Engineering and Physical Sciences Research Council (2)
Grant ID: 1169153
Grant ID: EP/J013854/1
Medical Research Council (2)
Cell-matrix biology of the vascular progenitor cell niche.
Professor Cay Kielty, The University of Manchester
Grant ID: G0902170
Investigating and manipulating the changing display of glycosaminoglycan epitopes during ES cell differentiation
Professor Merry, The University of Manchester
Grant ID: G0701165
NIGMS NIH HHS (1)
Grant ID: P41 GM103490
National Centre for the Replacement, Refinement and Reduction of Animals in Research (1)
A multi-cellular 3D model of human breast tissue to replace rodent xenograft models in breast cancer research.
Professor Merry, University of Nottingham
Grant ID: NC/N001583/1
National Institutes of Health (1)
Grant ID: GM103490


